
Approach 1: PUMA Discounted Cash Flow (DCF) Analysis
A Discounted Cash Flow, or DCF, model estimates what a company might be worth today by taking projected future cash flows and discounting them back to their value in the present.
For PUMA, the model used is a 2 Stage Free Cash Flow to Equity approach. The latest twelve month free cash flow is a loss of €13.39 million, so the story here is mainly about future expectations rather than current cash generation. Analysts and internal estimates feed into a ten year path of free cash flow in millions of €, with specific projections such as €110.40 million in 2026, €201.85 million in 2027 and €256 million by 2030. Estimates beyond the usual analyst horizon are extrapolated by Simply Wall St.
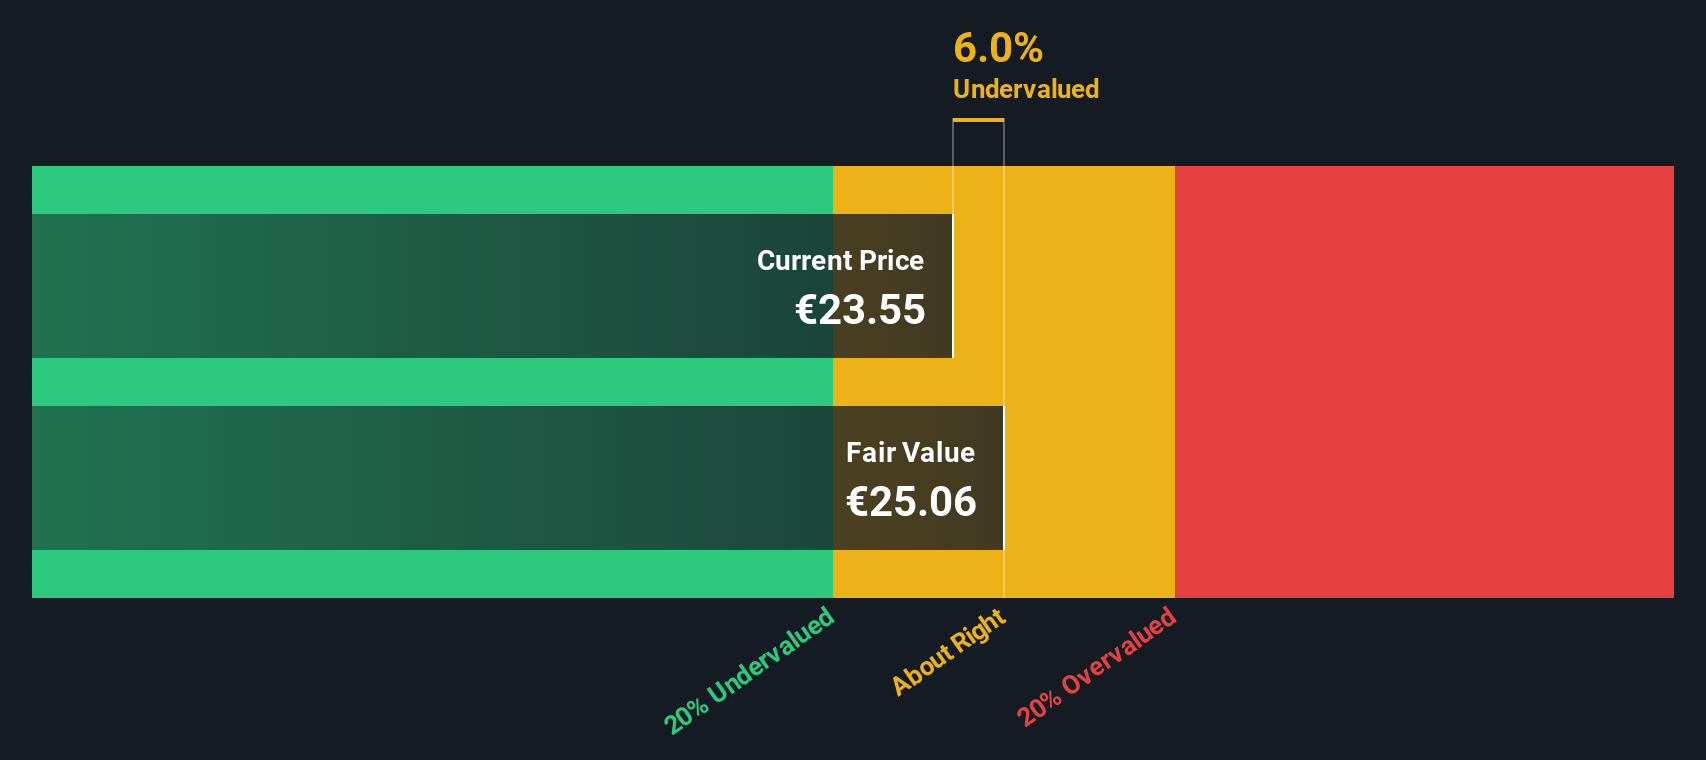
When all these projected cash flows are discounted back, the DCF model arrives at an estimated intrinsic value of about €25.73 per share. Compared with the recent share price of €23.35, this implies the shares are roughly 9.2% undervalued on this model. This is a modest gap rather than a huge mismatch.
Result: ABOUT RIGHT
PUMA is fairly valued according to our Discounted Cash Flow (DCF), but this can change at a moment’s notice. Track the value in your watchlist or portfolio and be alerted on when to act.
 PUM Discounted Cash Flow as at Jan 2026
Approach 2: PUMA Price vs Sales
For a company like PUMA, where earnings can be pressured and free cash flow is currently negative, P/S is often more useful than P/E because sales tend to be less volatile than profits and can give you a cleaner read on what the market is paying for each € of revenue.
What investors usually see as a “normal” or “fair” trading multiple depends on a mix of growth expectations and risk. Higher expected growth or lower perceived risk can justify a higher P/S, while slower growth or higher risk tends to be associated with a lower P/S.
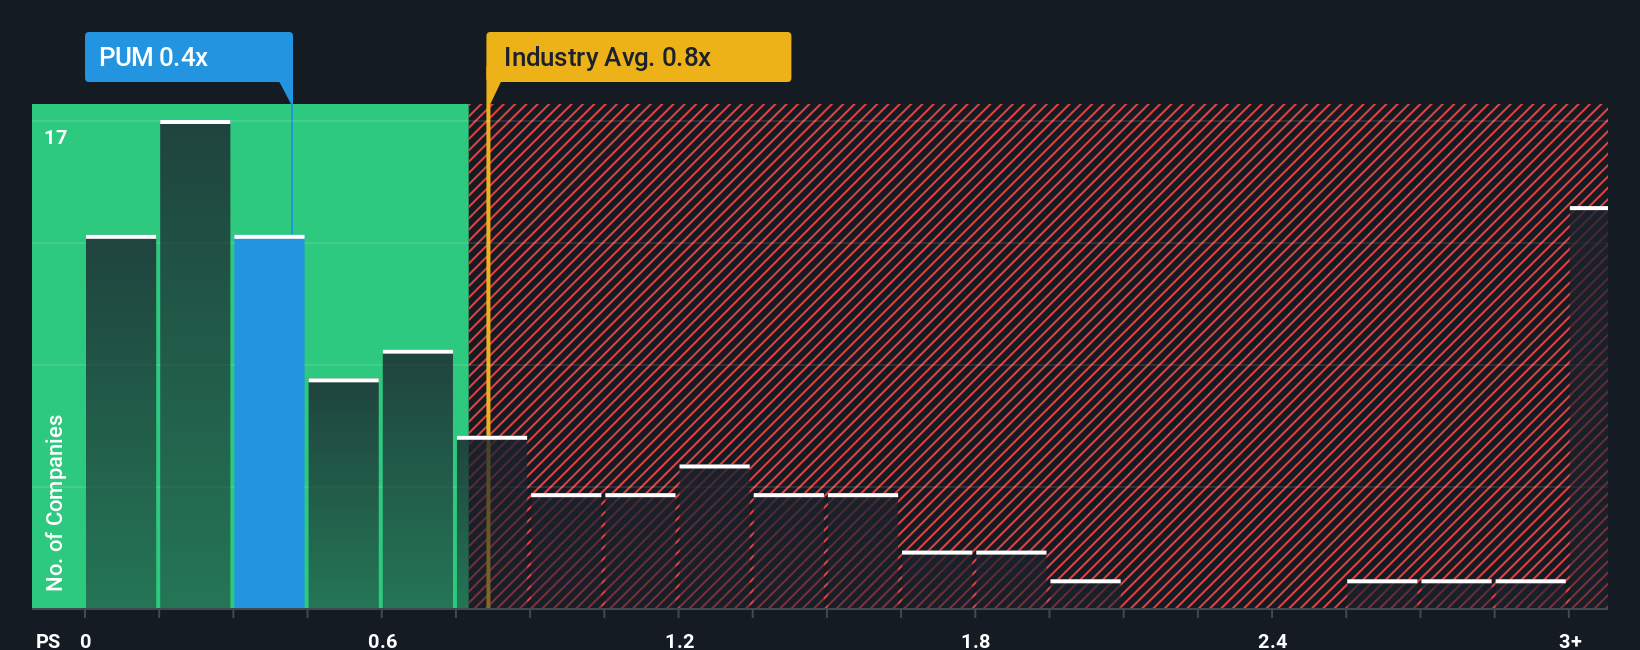
PUMA currently trades on a P/S of 0.41x. That sits below the Luxury industry average P/S of 0.83x and also below the peer average of 1.18x. Simply Wall St’s Fair Ratio for PUMA is 0.75x, which is its view of what a reasonable P/S might be once you factor in the company’s earnings profile, industry, profit margins, market cap and risk characteristics.
The Fair Ratio is more tailored than a simple comparison with peers or the sector because it adjusts for company specific traits rather than assuming all Luxury names deserve the same multiple. Set against the current 0.41x P/S, the 0.75x Fair Ratio suggests the shares are undervalued on this metric.
Result: UNDERVALUED
 XTRA:PUM P/S Ratio as at Jan 2026
P/S ratios tell one story, but what if the real opportunity lies elsewhere? Discover 1417 companies where insiders are betting big on explosive growth.
Upgrade Your Decision Making: Choose your PUMA Narrative
Earlier we mentioned that there is an even better way to understand valuation, so let us introduce you to Narratives, which are simply your own story for a company that connects your view on its future revenue, earnings and margins to an assumed fair value. On Simply Wall St’s Community page, Narratives let you plug in your expectations, link them to a financial forecast, and see what fair value that story implies compared to today’s share price. This can help you decide whether you see PUMA as closer to a buy, a hold, or a sell. Because Narratives are updated when new information such as news or earnings arrives, your story and the implied fair value stay in sync with what is happening. For PUMA, one investor might build a Narrative that points to a fair value well above €23.35 while another might create one that sits well below that price.
Do you think there’s more to the story for PUMA? Head over to our Community to see what others are saying!
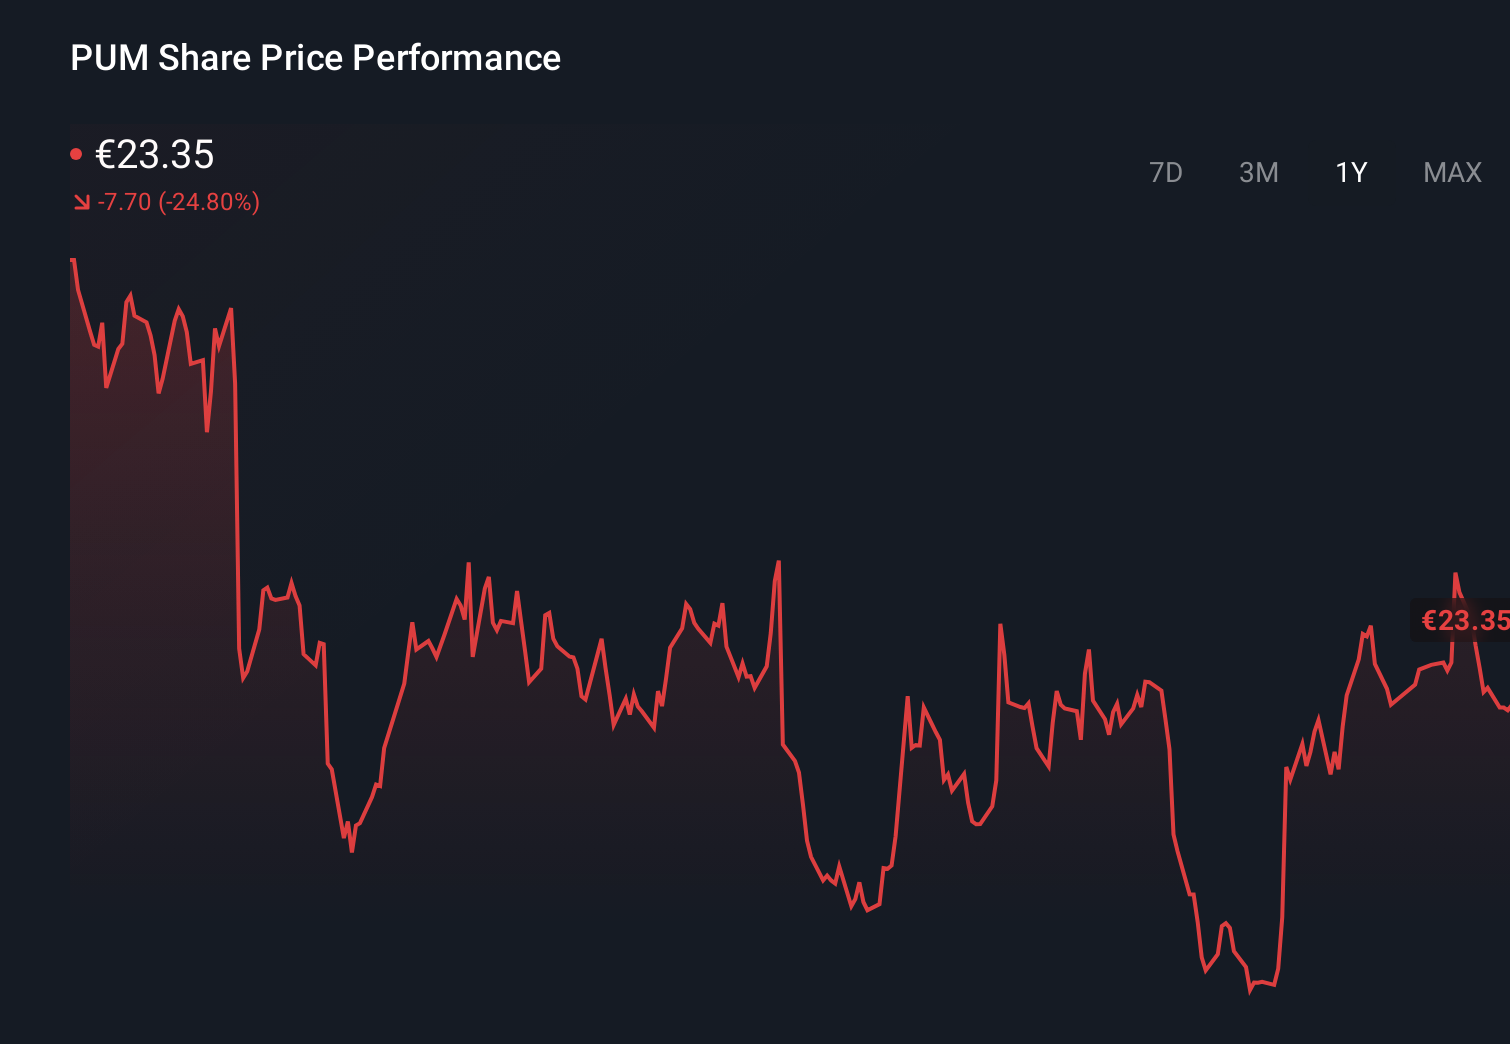 XTRA:PUM 1-Year Stock Price Chart
This article by Simply Wall St is general in nature. We provide commentary based on historical data
and analyst forecasts only using an unbiased methodology and our articles are not intended to be financial advice. It does not constitute a recommendation to buy or sell any stock, and does not take account of your objectives, or your
financial situation. We aim to bring you long-term focused analysis driven by fundamental data.
Note that our analysis may not factor in the latest price-sensitive company announcements or qualitative material.
Simply Wall St has no position in any stocks mentioned.
We’ve created the ultimate portfolio companion for stock investors, and it’s free.
• Connect an unlimited number of Portfolios and see your total in one currency
• Be alerted to new Warning Signs or Risks via email or mobile
• Track the Fair Value of your stocks
Have feedback on this article? Concerned about the content? Get in touch with us directly. Alternatively, email editorial-team@simplywallst.com