
Find out why Ally Financial’s 11.4% return over the last year is lagging behind its peers.
Approach 1: Ally Financial Excess Returns Analysis
The Excess Returns model looks at how much profit a company is expected to earn above the return required by its shareholders, then translates that into a per share value today.
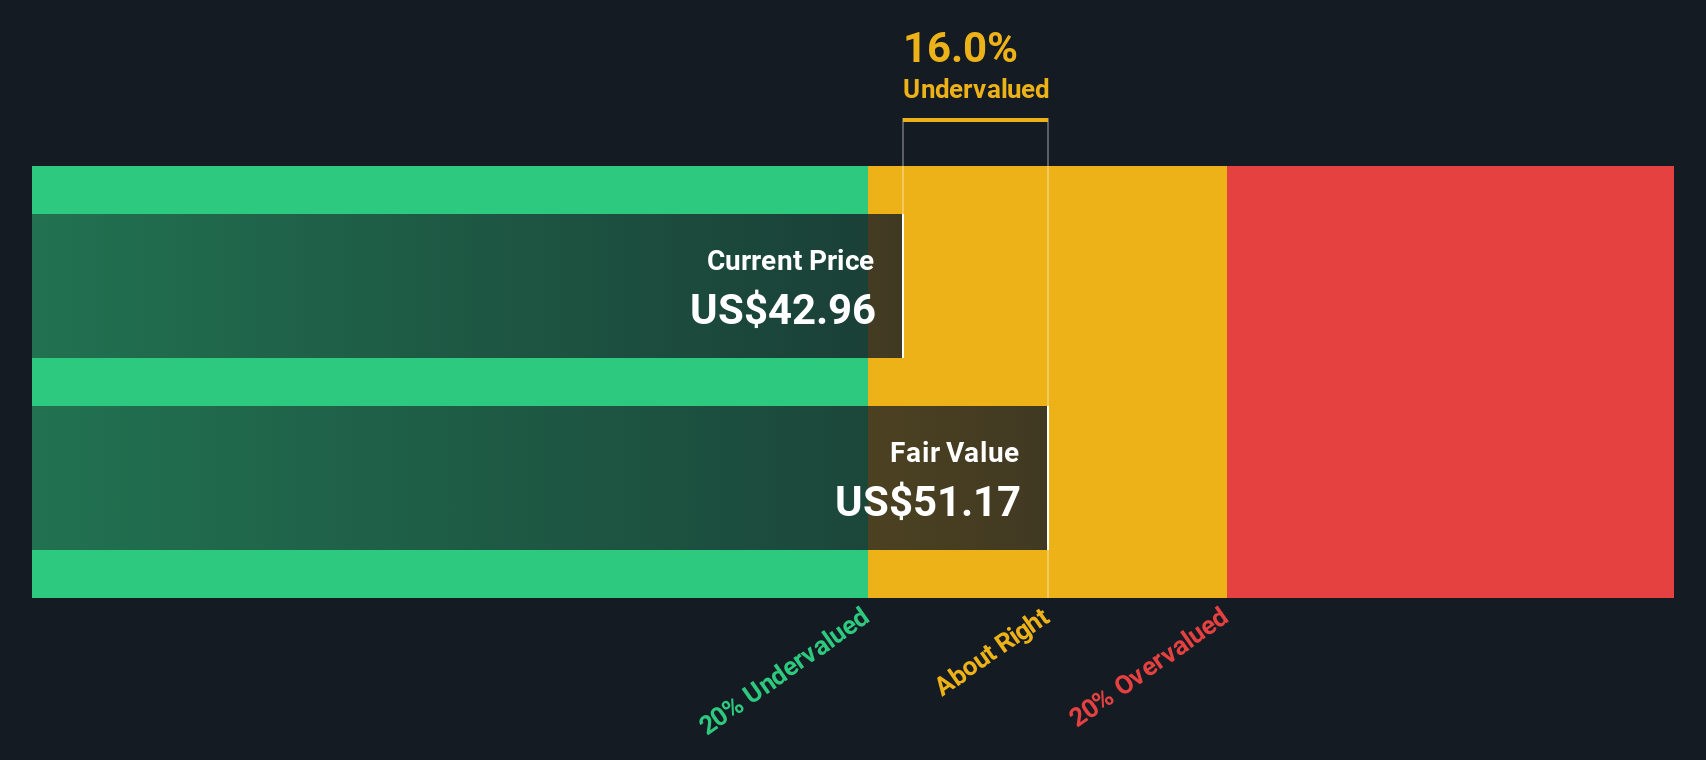
For Ally Financial, the model starts with a Book Value of $42.70 per share and a Stable EPS of $5.91 per share, based on weighted future Return on Equity estimates from 9 analysts. The Average Return on Equity is 12.10%, while the Cost of Equity is $5.71 per share. The difference between what shareholders require and what the business is expected to earn is captured as an Excess Return of $0.20 per share.
This analysis also uses a Stable Book Value estimate of $48.82 per share, sourced from weighted future Book Value estimates from 8 analysts. Combining these inputs, the Excess Returns model points to an intrinsic value of about $51.17 per share, which implies the stock is 16.0% undervalued compared with the current share price.
Result: UNDERVALUED
Our Excess Returns analysis suggests Ally Financial is undervalued by 16.0%. Track this in your watchlist or portfolio, or discover 866 more undervalued stocks based on cash flows.
 ALLY Discounted Cash Flow as at Jan 2026
Approach 2: Ally Financial Price vs Earnings
For a profitable company like Ally Financial, the P/E ratio is a useful way to think about what you are paying for each dollar of current earnings. Investors usually accept a higher or lower P/E depending on what they expect for future earnings growth and how much risk they see in the business.
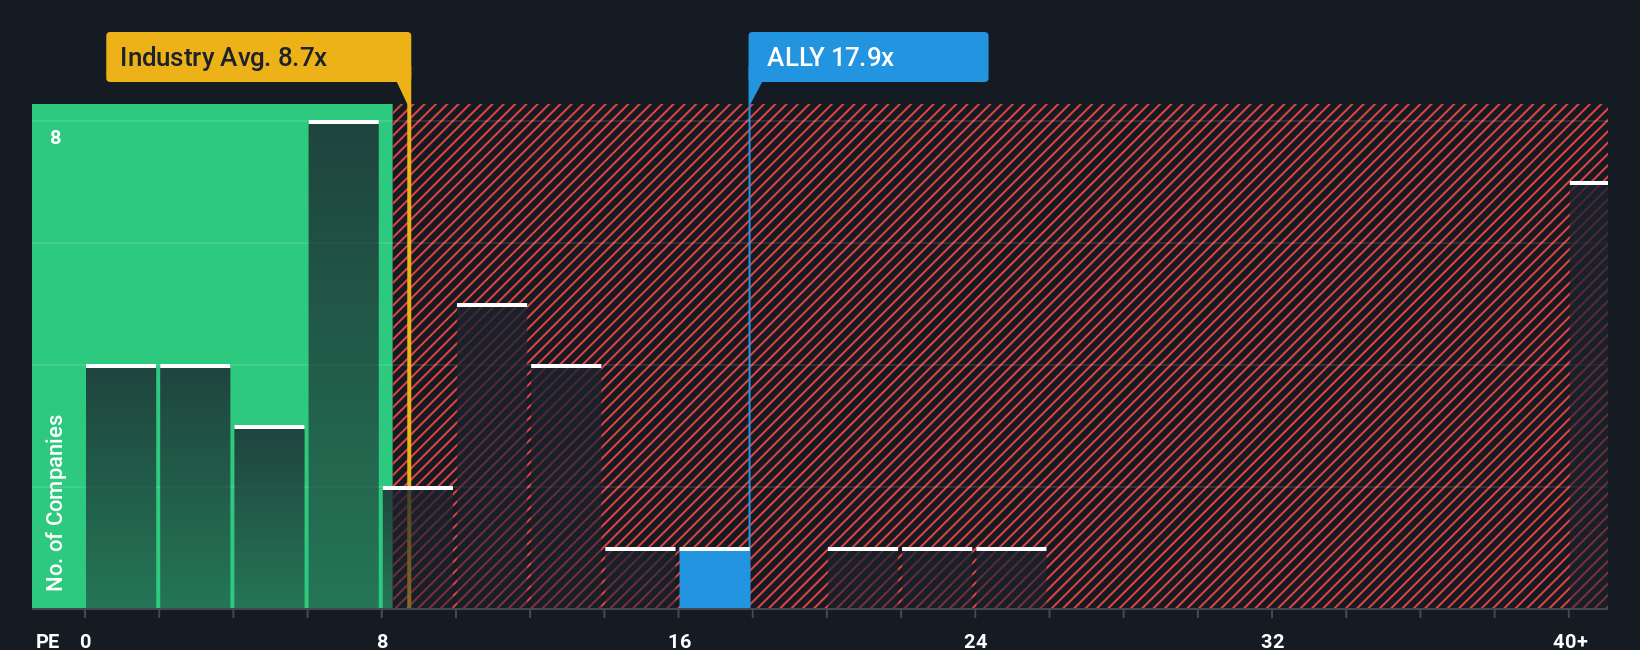
Ally Financial currently trades on a P/E of 17.86x. That compares with a Consumer Finance industry average P/E of 8.46x and a peer group average of 13.42x, so the shares change hands at a higher multiple than both of those benchmarks.
Simply Wall St also calculates a proprietary “Fair Ratio” to indicate what P/E might make sense given factors such as earnings growth, industry, profit margins, market cap and risk. For Ally Financial, this Fair Ratio is 18.62x. This approach aims to be more tailored than a simple peer or industry comparison, because it adjusts for the company’s own fundamentals rather than assuming all lenders should trade at roughly the same multiple.
Comparing the Fair Ratio of 18.62x with the current P/E of 17.86x suggests the shares are trading slightly below that modelled level.
Result: UNDERVALUED
 NYSE:ALLY P/E Ratio as at Jan 2026
P/E ratios tell one story, but what if the real opportunity lies elsewhere? Discover 1414 companies where insiders are betting big on explosive growth.
Upgrade Your Decision Making: Choose your Ally Financial Narrative
Earlier we mentioned that there is an even better way to understand valuation, so let us introduce you to Narratives, which are simply your story about a company, expressed through your own view of its fair value and your assumptions for future revenue, earnings and margins.
A Narrative connects what you believe about Ally Financial, such as how its auto finance and digital banking businesses might develop, to a concrete financial forecast and then to an estimated fair value that you can compare with the current share price.
On Simply Wall St, Narratives are easy to use within the Community page, where millions of investors share and update their views. The platform automatically refreshes each Narrative when new information like earnings reports or news is added.
This helps you decide how to act, because you can see whether your Narrative fair value is above or below the current price, and compare it with other users. For example, one investor might see Ally Financial as fairly valued only at a much higher price than today, while another might set a much lower fair value based on more cautious assumptions.
Do you think there’s more to the story for Ally Financial? Head over to our Community to see what others are saying!
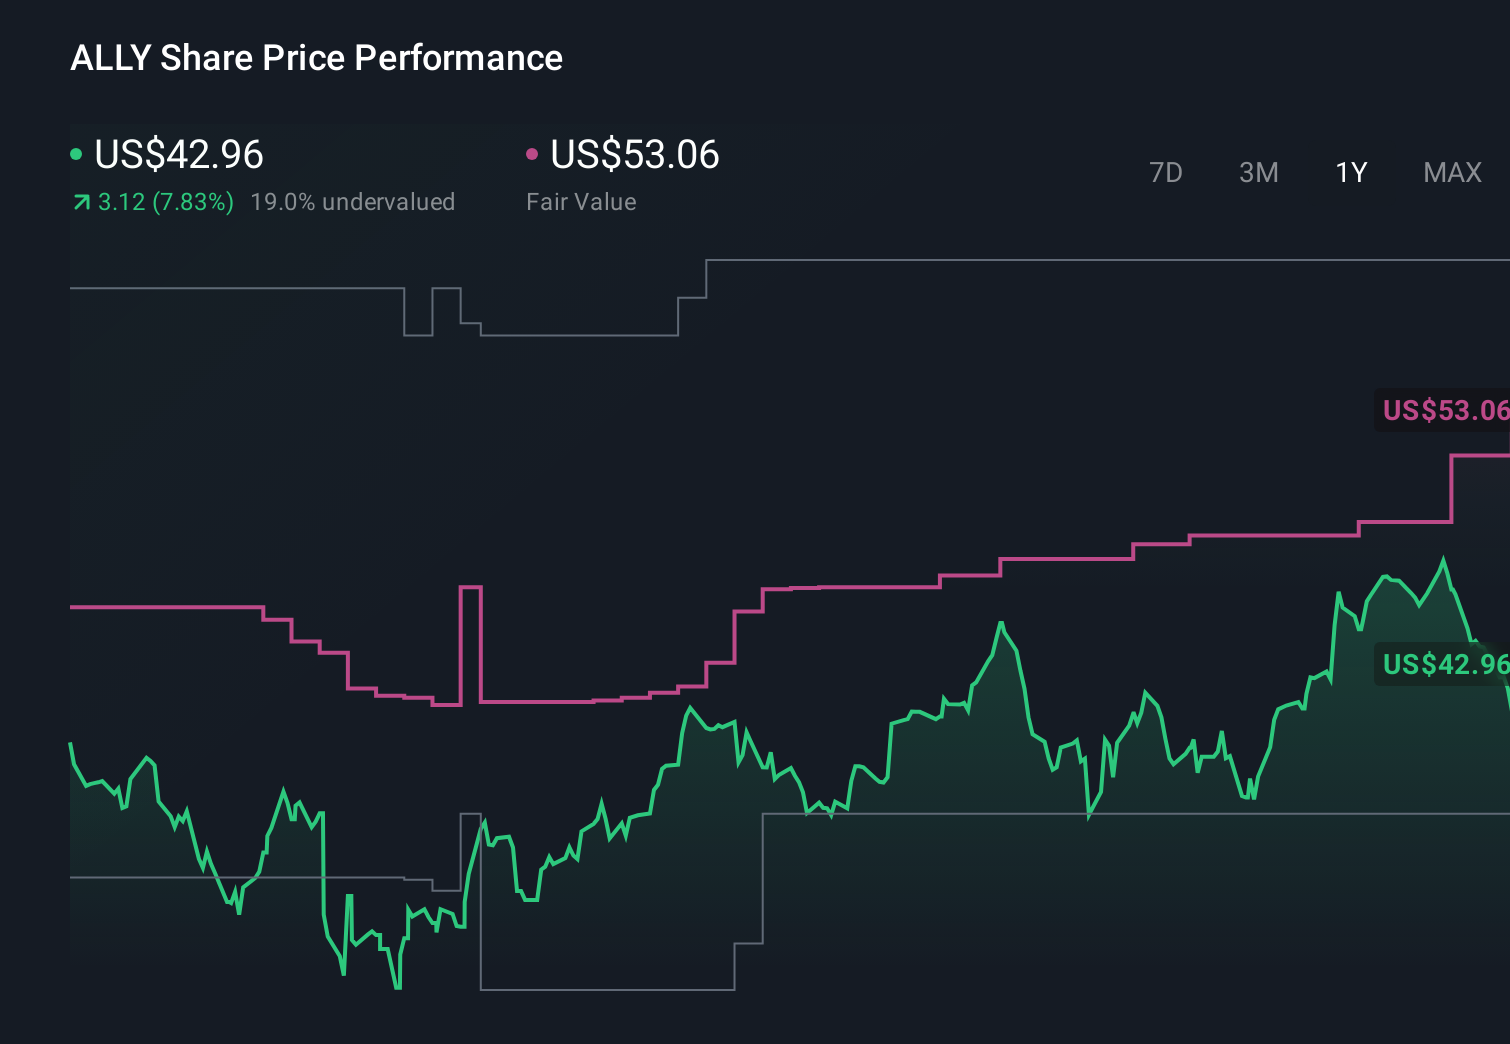 NYSE:ALLY 1-Year Stock Price Chart
This article by Simply Wall St is general in nature. We provide commentary based on historical data
and analyst forecasts only using an unbiased methodology and our articles are not intended to be financial advice. It does not constitute a recommendation to buy or sell any stock, and does not take account of your objectives, or your
financial situation. We aim to bring you long-term focused analysis driven by fundamental data.
Note that our analysis may not factor in the latest price-sensitive company announcements or qualitative material.
Simply Wall St has no position in any stocks mentioned.
We’ve created the ultimate portfolio companion for stock investors, and it’s free.
• Connect an unlimited number of Portfolios and see your total in one currency
• Be alerted to new Warning Signs or Risks via email or mobile
• Track the Fair Value of your stocks
Have feedback on this article? Concerned about the content? Get in touch with us directly. Alternatively, email editorial-team@simplywallst.com