
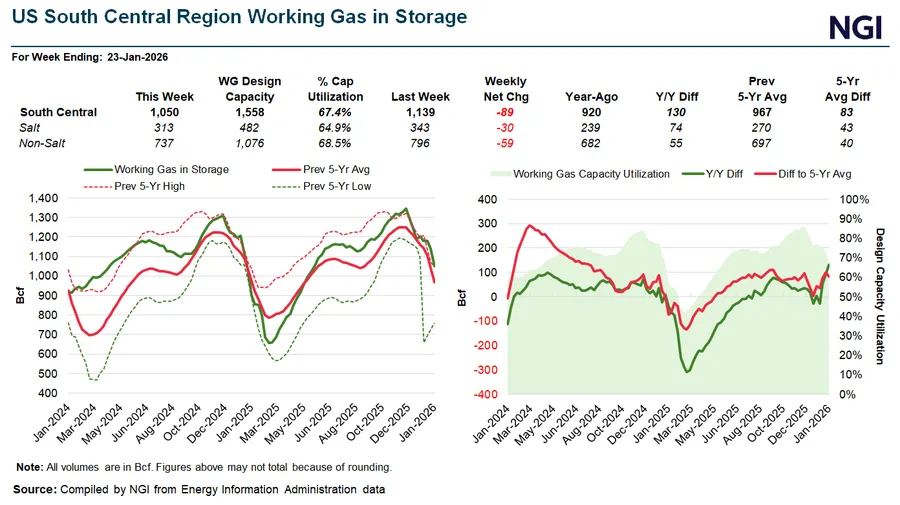
A whopping late January withdrawal of natural gas from storage in the South Central cut into excess supply, amplifying the effects of a widespread and bitter cold front that sent heating demand soaring and Permian Basin production into the doldrums.
Expand
At A Glance:
South Central storage pull of 89 BcfSurplus of gas narrows in regionPrices hold well above winter lows