Supplementary data 1 presents contamination levels and detection frequency of eight groups totaling 112 MOCs in Yangtze River sediments. These compounds were detected at concentrations ranging from 0.07 ng/g to 174.6 ng/g (dry weight), covering five orders of magnitude. Total MOC concentrations (∑ 112 MOCs) in sediments varied from 163.8 to 1025 ng/g (Fig. 1a), averaging 403.2 (median: 346.3 ng/g). Phthalate esters (PAEs) (median: 163.2 ng/g) and polycyclic aromatic hydrocarbons (PAHs) (median: 174.6 ng/g) dominated (88%) in the total concentrations, while antibiotics (median: 11.88 ng/g) and pharmaceuticals and personal care products (PPCPs) (median: 5.84 ng/g) constituted minor fractions. And other four pollutants (polychlorinated biphenyls (PCBs), polybrominated diphenyl ethers (PBDEs), neonicotinoid insecticides (NNIs), and PFASs) showed negligible levels (0.07–0.14 ng/g).

(a) median concentration. (b) median RQ. Interpolated values are based on the nearest MOC concentrations and RQ readings, depicting a continuous gradient. Red indicates higher MOC concentrations and RQ. Green indicates lower MOC concentrations and RQ.
The 20 MOCs with the highest median (13 PAHs, 5 PAEs, 1 PPCP and 1 antibiotic) and maximum (11 PAHs, 4 PAEs, and 5 antibiotics) concentrations were presented in Fig. 2a, b, respectively. The median and maximum concentrations were 1.35–50.52 ng/g and 141.9–356.4 ng/g, respectively. Bis (2-ethylhexyl) phthalate (DEHP) was the one with the highest median concentration while Naphthalene (Nap) was of the highest maximum concentration. The top 10 MOCs in both median and maximum concentrations were PAHs and PAEs. Within the MOCs being ranked 10–20, in term of the median concentrations, except that 4-Nonylphenol (4-NP) and Chlortetracycline (CTC) were ranked 18th and 20th, respectively, the rest were PAEs and PAHs, while for the maximum concentration there were five antibiotics and five PAHs. PAHs derived primarily from combustion processes (waste incineration, coal burning, vehicle exhaust, oil spills)20, while PAEs entered ecosystems through industrial applications including plasticizers, solvents, adhesives, and consumer products (perfumes, cosmetics, pharmaceuticals)21. As China’s predominant plasticizer, DEHP leads PAE consumption, correlating with its high detection levels in Yangtze River22,23. Antibiotics in the Yangtze River Basin were mainly influenced by the scale of local livestock and poultry farming9. From the overall concentration level in the Yangtze River, PAHs and PAEs were the main pollutants. In addition to this, antibiotics was a group of MOCs which should not be ignored particularly from the local contamination level.
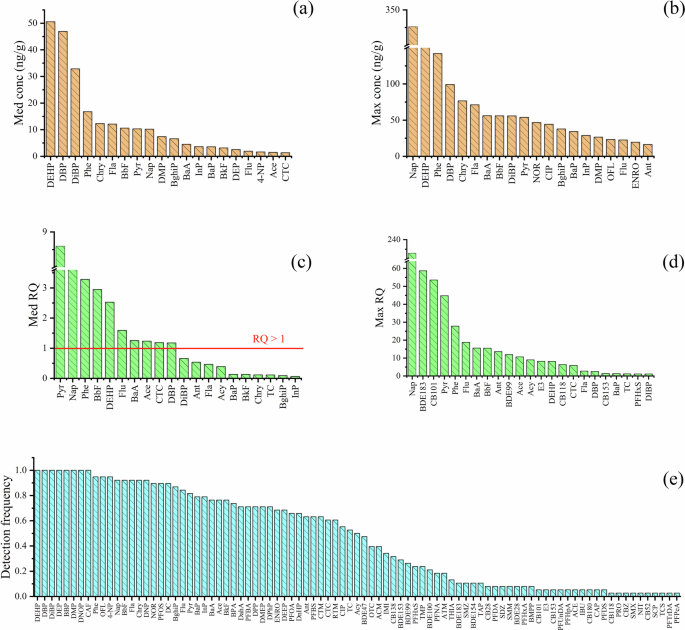
(a) Median concentration, (b) maximum concentration, and (c) median RQ of top 20 MOCs. (d) maximum RQ (RQ > 1) and (e) detection frequency (DF > 0) of MOCs. In figure c, the red line represents RQ = 1, and the area above the red line represents RQ > 1.
Across all sites, 25–56 MOCs were detected with 22 compounds detection frequencies over 80%, predominantly by PAEs (8) and PAHs (8), followed by antibiotics (3), PPCPs (2) and PFASs (1). Seven PAEs (Dimethyl phthalate (DMP), Diethyl phthalate (DEP), Di-n-butyl phthalate (DBP), Di-isobutyl phthalate (DiBP), Benzyl-n-butyl phthalate (BBP), DEHP, and Di-n-octyl phthalate (DNOP)) and one PPCP (Caffeine (CAF)) were ubiquitously detected in every sediment sample (Fig. 2e). Widespread use of PAEs has resulted in their pervasive environmental occurrence21. The dominant PAEs (DEHP, DBP, and DiBP) in this study were also extensively detected throughout Yangtze River sediments by previous studies24. These chemicals are readily liberated from plastics via volatilization, abrasion and leaching, subsequently entering the aquatic environment. Their adsorption and stabilization by sediments could explain the prevalence in the Yangtze River Basin. Conversely, 23 contaminants remained undetected across all sampling sites, comprising 5 antibiotics, 2 PAEs, 7 NNIs, 7 PPCPs, and 2 PFASs.
The published literature on Yangtze River Basin sediments (2013–2023) revealed median MOC concentration ranging from 5 ×10⁻⁵ ng/g to 835 ng/g13, slightly lower than those in this study. While DEHP and DBP consistently emerged as dominant contaminants (>100 ng/g)13, the concentrations in this study were ~50% lower. PCBs and PFASs concentrations were at 0.71 ng/g and 0.25 ng/g13, respectively, which aligned with our findings. By contrast, reported median concentrations of antibiotics (<0.1 ng/g) were markedly divergent from our study (4.95 ng/g). Overall the above differences were mainly due to the contaminants type and quantity, in addition to the time scale which Wen et al.13 summarized 11 years of monitoring data from various literatures while the data in this study was based in the same sampling period.
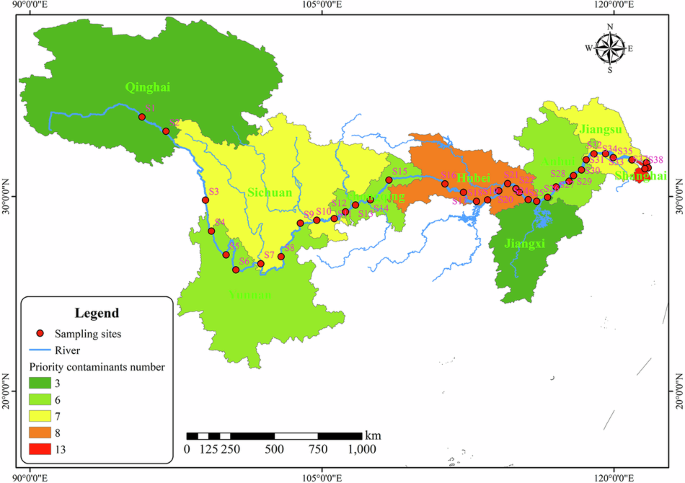
In terms of spatial distribution, the sediments showed a pattern of upstream (median: 370.6 ng/g) < midstream (median: 372.1 ng/g) < downstream (median: 464.8 ng/g). Concentrations of MOCs and the number of detected pollutants in each province of the Yangtze River were shown in Fig. 3a, b. Jiangxi had the highest total concentration of 610.4 ng/g, followed by Shanghai (463.9 ng/g) and Chongqing (455.6 ng/g), and Qinghai had the lowest at 214.7 ng/g (Fig. 3a). Also Qinghai had the lowest number of MOCs detected, which remained at 50 with 15 PAEs, 16 PAHs, 7 PFASs, 5 Antibiotics, 4 PBDEs, 2 PPCPs and 1 NNI. Jiangsu, located downstream, was detected with 76 MOCs, including 15 PAEs, 16 PAHs, 9 PFASs, 15 antibiotics, 5 PCBs, 7 PBDEs, 7 PPCPs, and 2 NNIs, making it the province with the highest number of MOCs detected. The next four provinces were Sichuan, Chongqing, Hubei and Jiangxi with 61–70 MOCs detected, while Yunnan, Anhui and Shanghai had fewer MOCs with 51–60 MOCs detected (Fig. 3b). The highest concentration in Jiangxi Province was detected with 15 PAEs, 16 PAHs, 4 PFASs, 15 antibiotics, 2 PCBs, 5 PBDEs, and 4 PPCPs. The difference in the number of MOCs detections among provinces is mainly on the increase in the number of detections of ECs.

(a) Total concentration, (b) number of detections, (c) RQ and (d) prioritization scores. In the figures a and b, the darker parts indicate higher value. In the figures c and d, green indicates lower values and red represents higher values.
The RQ distribution was as below, midstream (RQ = 0.53) < upstream (RQ = 0.58) < downstream (RQ = 1.09) (Fig. 1b). 24 MOCs posed varying degrees of ecological risk (Med RQ), with 10 MOCs exceeding high-risk thresholds (e.g., 7 PAHs, 2 PAEs and 1 Antibiotic, Fig. 2c). Among these, Pyr (Med RQ = 8.60) and Nap (Med RQ = 7.29) exhibited peak ecological risks. The other eight compounds (Phenanthrene (Phe), Benzo[b]fluoranthene (BbF), Fluorene (Flu), Acenaphthene (Ace), Benz[a]anthracene (BaA), DEHP, DBP, CTC) also showed Med RQ ≥ 1, which indicated potential threat to the aquatic ecosystem. Medium risks were observed for 8 MOCs (6 PAHs, 1 PAE, and 1 Antibiotic), 5 MOCs exhibited low risk while 66 MOCs demonstrated minimal risk (Supplementary data 2). The remaining 23 MOCs were undetected, however, considering the precautionary principle they were also included for the assessment by EHPi method (totally 112 MOCs).
The ubiquitous presence of high- to low-risk MOCs across all sampling sites demonstrated pervasive ecological threats throughout the Yangtze River Basin, necessitating urgent control measures. Spatially, high-risk contaminant frequency increased downstream, with DEHP exceeding Med RQ ≥ 1 universally. Phe posed high risk at >80% of sites (moderate elsewhere), while Nap showed high risk at 89% of sites. Despite low detection frequency, CTC posed high ecological risk at every site detected. This 100% high-risk incidence upon detection warrants inclusion of CTC in the targeted monitoring programs, even given its low occurrence. DBP and DiBP consistently exhibited medium -to-high risk across all sampling sites. Conversely, Ace, Flu, and BbF posed high risk predominantly in midstream and downstream areas.
The top 23 MOCs with the highest maximum risk (Max RQ) were listed in Fig. 2d, all of which constituted high risk, including 11 PAHs, 3 PAEs, 3 PCBs, 2 antibiotics, 2 PBDEs, 1 PFAS, and 1 PPCP. The highest risk one was Nap with a Max RQ of 232.9, followed by BDE183 and CB101 with Max RQs of 58.70 and 53.56, respectively. The smallest DiBP was with a Max RQ of 1.12. Unlike the median risk, the maximum risk has a increase in the number of MOC categories, from 3 to 7, and a increase in the proportion of ECs. Therefore, from the perspective of the average risk level of the basin, PAH, PAE and antibiotics were important pollutants, while from the perspective of localized high-risk zones, in addition to the three CCs (PAHs, PAEs, PCBs), there were four ECs (antibiotics, PPCPs, PFASs, and PBDEs), all of which were with major risks. Therefore, it remains to be explored whether it is the CCs or the ECs that are more worthy of our attention.
Priority list of MOCs in the whole Yangtze River basin
The EHPi scores and grouping results of 112 MOCs in the whole Yangtze River basin were shown in Fig. 4 and Table 1. Group I included 4 PAHs (Nap, Pyr, Phe, BbF) and 3 PAEs (DEHP, DBP, DiBP). Pollutants in Group I require immediate control, with the EHPi ranging from 3.32 to 7.13, driven predominantly by their high occurrence frequencies, ecological risks, and concentrations (Fig. 5). All seven MOCs had high detection frequency scores. DEHP, DBP and DiBP had high median concentration scores while Phe, Pyr and BbF had high maximum risk scores. In addition, Phe had a high maximum concentration score. Nap was ranked first due to its four EHPi index parameters with high scores (except median concentration). Group Ⅱ, included 38 medium-risk pollutants (12 PAHs, 10 PAEs, 9 antibiotics, 4 PFASs, and 3 PPCPs), necessitating targeted monitoring, with detection frequency being the primary scoring factor. Group Ⅲ, included 46 low-risk pollutants (10 antibiotics, 9 PFOS, 7 PBDEs, 7 PCBs, 4 NNIs, 4 PPCPs, and 1 PAE), warranting routine management. Group IV comprised 23 undetected pollutants requiring periodic surveillance to prevent potential future hazards.

The top black line represents a EHPi score of 3, and the bottom black line represents a EHPi score of 1, and the red box represents a EHPi score of 0.

The EHPi scores of top 7 MOCs based on frequency, median concentration (Med conc), maximum concentration (Max conc), median RQ (Med RQ) and maximum RQ (Max RQ). The EHPi legend displays the above five parameters in the form of EHPi slices. Different colors and positions represent these 5 aspects. For each slice, the distance to the origin represents the normalized value of the variable, and the width represents the relative weight of the variable.
PAEs exhibit endocrine disrupting effects on human and wildlife, including reproductive toxicity, developmental impairment, and carcinogenicity21,25. While PAHs have been formally characterized as having carcinogenic potential by targeting the nervous, respiratory and endocrine systems26. Consequently, both classes have been designated “chemical of concern” under EU and US Environmental Protection Agency (USEPA) frameworks27. Notably, China aligns well with global regulatory efforts by prioritizing similar six PAEs (DMP, DEP, DBP, BBP, DEHP, DnOP) and five PAHs (Nap, Ace, Pyr, Phe, Ant) as the USEPA and EU (Supplementary data 3)27,28. This regulatory consensus validated that our identification of these contaminants as high-priority control by EHPi, which could further support that this method can be used for ranking priority substances for environmental management and control.
Divergences emerged between EHPi prioritization in this study and existing regulations. Nap was prioritized by U.S. EPA and China but it was unregulated in the EU, which was ranked highest in our study due to its ubiquitous occurrence and max risk, despite moderate concentrations. Phe, Pyr, DBP, and DEHP exhibited regulatory gaps in China despite of U.S and EU lists27. The low median concentrations for these compounds can easily cause the risks to be overlooked, while their maximum concentrations were reaching 2–10 times of the median ones, thus requiring increased concerns in certain areas10,29. DiBP (globally regulated, EHPi ranked #6) and BbF (China specific priority, EHPi ranked #7) further highlighted jurisdictional inconsistencies. PAHs dominated the top-tier risks, which aligned with China’s control list (BaA, BbF, BkF, Bap, DahA), reflecting intensified focus on multi-ring PAH carcinogenicity30. Perfluorooctane sulfonic acid (PFOS) and Perfluorooctanoic acid (PFOA) have caused concerns by various countries, which were placed in the Group Ⅱ in this study, with being ranked 26 and 38, respectively. PFOS was included in the list of all collected priority lists (see Supplementary data 3). China’s list of emerging priority pollutants released in 2023, which explicitly banned the production of PFOA and PFOS.
Priority list of MOCs at the provincial scales of Yangtze River basin
Spatial heterogeneity of priority pollutants necessitates region-specific management strategies. Pollutants with high EHPi scores exhibited inter-provincial variations, demanding different regulatory interventions. For instance, Nap dominated priority lists in the upper-midstream provinces (except for Sichuan), while Pyr was ranked highest in the downstream provinces and Sichuan (Table 2 and Supplementary data 2). Numerous studies have shown that Nap and Pyr were mainly derived from incomplete combustion of biomass (e.g., coal tar, crop residues, etc.), in addition to pesticide application as it is used to make pesticides12,26. This is particularly relevant given the study area encompasses 27.6 million hectares of cropland, representing 28.3% of China’s total agricultural land (97.4 million hectares, 2019). Consequently, PAHs warrant prioritized control in provinces along Yangtze River Basin with intensive agro-industrial activities. DEHP was ranked as the fifth in Qinghai, the third in other upstream provinces and Hubei, and the second in Jiangxi and downstream provinces. This spatial pattern correlates with industrial activities22,31. Qinghai has the lowest plastic production in the study area at 0.015 million tons in 2019 (Supplementary data 4), which could therefore contribute to the lowest DEHP ranking of all provinces in Qinghai.
The EHPi scores of 112 MOCs in each province of the Yangtze River Basin were shown in Fig. 3d. The order of the EHPi scores of each province was Shanghai (1.14) > Jiangsu (1.11) > Hubei (1.04) = Sichuan (1.04) > Jiangxi (1.03) > Anhui (0.99) = Chongqing (0.99) > Yunnan (0.98) > Qinghai (0.89). The provincial priority divergences were extended to risk group composition, Shanghai contained 13 priority substances (10 PAHs, 3 PAEs) in Group I, reflecting its peak socioeconomic status (highest GDP/urbanization; Supplementary data 4), whereas Qinghai and Jiangxi had only three. The number and types of priority list subgroups varied among provinces, for example, in the Group I, Shanghai had the most with 13 ECs, including 10 PAHs and 3 PAEs, and Qinghai and Jiangxi had the fewest with only three, including 2 PAHs and 1 PAEs. Shanghai is one of the most developed regions in China, with the highest GDP per capita and urbanization rate, far exceeding other provinces in the study areas (Supplementary data 4). Shanghai leads in coal and oil consumption (Supplementary data 4). According to statistics, the consumption of gasoline and diesel fuel in Shanghai in 2019 was 0.64 and 2.06 million tons, respectively. Studies have confirmed that vehicle emissions and some coal and biomass combustion were the main sources of PAHs in Shanghai32,33.
The results of Group Ⅰ of EHPi scores for each province in the Yangtze River Basin were shown in Supplementary Figs. 1–9. Consistent with basin-wide patterns, DBP and DEHP concentrations were highest in most provinces, such as Sichuan, Yunnan, Chongqing, Hubei, Anhui, and Shanghai. DBP and DIBP were used as plasticizers in polyvinyl chloride, while DEHP was the most widely used plasticizer in polymer products22. Strong human activities have led to the Yangtze River Basin to generate a large amount of PAEs production and consumption, for example, the production of plastics in Sichuan, Hubei, and Anhui in 2019 was 4.49, 5.26, and 6.83 million tons, respectively (Supplementary data 4). Nap has high concentrations in the upper reaches of the Yangtze River, ranking among the top five MOCs in the upstream provinces, and lower in the middle and lower reaches (except for Jiangxi). In Jiangxi, the highest MOC was Nap, with a concentration of 114.8 ng/g. Even for the same MOCs, the concentration varies greatly in different provinces, for example, Nap in Jiangxi was nearly 20 times higher than that in Anhui (6.44 ng/g) (p < 0.05), while Pyr in Shanghai (29.28 ng/g) was nearly 80 times higher than that in Qinghai (0.38 ng/g). 70% of Nap was mainly used in the manufacture of dyes, mothballs, leather, and wood protection agents. Only 6% of Nap was used in the production of pesticides34,35. Whereas the sampling sites in Jiangxi were all built land, the sampling sites in Anhui were near cropland. This leads to a huge difference in the detected concentration of Nap. In addition, local hydraulic conditions may influence MOCs distribution in sediments. In our study area, the annual average runoff volumes for S12 (upstream), S16 (midstream), S21 (midstream), and S28 (downstream) in 2019 were reported to be 274.8, 446.6, 713.2, and 933.4 billion m3, respectively10. During low flow periods, hydrophobic MOCs not only readily adsorb onto particles but can also further settle24. Therefore, the higher runoff in the middle and downstream may lead to increased concentration dilution and resuspension of surface sediments, which contributed insignificant spatial differences to some extent, although these regions might have higher pollution inputs of MOCs. Therefore, different measures to control MOCs in different areas are necessary.
The high-risk distribution of MOCs in the Yangtze River was midstream (RQ = 0.53) < upstream (RQ = 0.58) < downstream (RQ = 1.09). Sichuan and Jiangxi had the highest number of high-risk (RQ > 1) pollutants (both with 13), while Yunnan and Qinghai had the fewest (both with 6), and all other provinces had 11-12 high-risk pollutants. The results of the RQ values for each province indicated that MOCs posed risks to all of them, with Jiangsu, Hubei and Qinghai being at moderate risk and all other provinces reaching high risk (Fig. 3c). Therefore, it is imperative to control MOCs in the Yangtze River basin. Although Nap and Pyr concentrations were not the highest, Nap and Pyr were at higher risk in the Yangtze River Basin and were the highest risk MOCs among the provinces due to their lower PNEC values. Nap and Pyr were the most risky MOCs in each province. Nap with high risk was mainly in the middle and upper provinces, while Pyr was in the downstream provinces. Nap was with the highest risk in Jiangxi, followed by Chongqing, with RQs of 81.98 and 33.45, respectively. And Pyr, despite ranking second among risky pollutants in Jiangxi (RQ value of 21.28), which was higher than all other provinces (except Shanghai (RQ value of 24.40)). Following the same pattern with the concentration, the risk of Nap in Jiangxi was nearly 20 times higher than that in Anhui (with an RQ of 4.60). While for Pyr, the risk in Shanghai was nearly 80 times higher than that in Qinghai (with an RQ of 0.31). The composition of risky pollutants and the level of risks varied greatly from province to province, so management measures for MOCs should be developed accordingly, taking into account the actual pollution in each province.
Divergences between EHPi prioritization in this study and existing regulations emerged. For example, Shanghai, Sichuan, Anhui and Jiangxi have included emerging pollutants such as PFASs, NNIs and antibiotics as priority pollutants for local regulation, while ignoring traditional pollutants. However, the results of this study showed that CCs were located in the Group I of the priority list, while ECs were mostly located in the Group II and Group III, therefore, CCs should be emphasized while considering ECs in the development of local regulatory measures.
Sensitivity analysis
The proposed methodology contains three key uncertainties. (1) Data representativeness: using maximum values (Cmax, RQmax) enhanced hotspot detection, spatial sampling density (38 sites across 6300 km river length) may underrepresent local pollution. Future studies should employ nested sampling designs near known emission sources. (2) Weighting subjectivity: The assigned weights (WF = 2, WRQ = 2, WC = 1) emphasized detection frequency and toxicity over concentrations. Sensitivity analyses using alternative weighting schemes (e.g., equal weights) showed ±2% variation in Group I pollutant rankings (Supplementary data 5). (3) Toxicity extrapolation: Chronic toxicity data for 23% of MOCs (n = 26) relied on assessment factors (AF = 10–100) due to insufficient species of toxicological data coverage. This conservative approach may underestimate risks for compounds with limited ecotoxicological data.
Recommendations
While ECs attract significant attention, the persistent threat of CCs (e.g., PAHs and PAEs) in surface water remains critical and is often underemphasized. Exclusive focus is on ECs risks while neglecting CCs, which continue to impact environmental and human health. Effective management requires a dynamically updated priority pollutant control list, emphasizing continuous monitoring and stricter remediation standards for CCs. Crucially, toxicological data for many MOCs are still lacking, necessitating comprehensive testing to fully assess their ecological and health impacts. In this Yangtze River study, while CCs (e.g., PAHs, PAEs) were prioritized higher at the whole basin and provincial scales, ECs (e.g., PFASs) were not classified in Group I. This highlights the current dominance of CCs although it does not diminish the potential risks of ECs. Therefore, substances prioritization must be regularly updated with new data on the contaminants.
The establishment for a control list of priority pollutants took into account the concentration, detection frequency and environmental risk (toxicity) of the MOCs, which was integrated with the principle of risk maximization. It is recommended that Group I should be established in the whole process of tracking and monitoring lists, i.e., from the chemical production, the use of the chemical and their emission to the environment. The Group II were mainly commonly detected pollutants, but their concentrations and environmental risks were low. Environmental monitoring of these pollutants should be strengthened, and chemical toxicology data should be improved to ensure that they are controlled at a quick speed when they are found to pose a threat to the ecological environment and human health. The Group III were the pollutants with low detection frequency, low concentration and low risk, which should be monitored daily to avoid environmental risks. The Group IV were the pollutants whose concentration were below the detection limit, and these pollutants should be regularly monitored, and the detection method should be improved to monitor their environmental concentrations.
In addition, the groups of priority pollutants in the provincial and basin differ greatly in both MOCs quantity and MOCs group. For example, although BDE183 was in Group III in the basin-wide list, it was included in Group I in Anhui and Jiangsu, and in Group II in Chongqing and Sichuan. BDE183 was also listed on the China Hazardous Chemicals Inventory. Therefore, the management of MOCs should refer to the priority list of the whole basin, at the same time, it should also take into account the actual situation of each province, referring to the priority list of each province and formulating well-targeted measures, which could help to accurately control the MOCs. A provincial joint prevention and control mechanism should be established to share information and jointly control MOCs in the Yangtze River basin.