August WTI crude oil futures posted a steep decline during the week ending June 19 as traders aggressively removed geopolitical risk premium from the market following a breakthrough agreement between the United States and Iran. The contract traded between a high of $81.00 and a low of $72.83 before settling at $75.22, down $7.22, or 8.73%, from the previous week’s close.

The selloff extended throughout most of the week as traders shifted their focus from fears of supply disruption in the Persian Gulf to the prospect of additional Iranian barrels returning to the global market. While underlying inventory data remained supportive, the market largely viewed the diplomatic developments as a major bearish catalyst capable of easing supply concerns that had driven prices sharply higher earlier this year.

Iran Agreement Removes Geopolitical Risk Premium

The dominant story for crude oil traders was the rapid progress toward a U.S.-Iran agreement designed to end months of conflict and restore commercial oil flows through the Strait of Hormuz. Reports throughout the week indicated that the agreement would reopen the vital shipping corridor while allowing Iran to resume oil exports under a sanctions waiver framework. Market participants quickly focused on the potential return of Iranian crude exports, significantly improving global supply expectations.

The agreement culminated with the White House sending the text of the interim accord to Congress on June 18.…
August WTI crude oil futures posted a steep decline during the week ending June 19 as traders aggressively removed geopolitical risk premium from the market following a breakthrough agreement between the United States and Iran. The contract traded between a high of $81.00 and a low of $72.83 before settling at $75.22, down $7.22, or 8.73%, from the previous week’s close.

The selloff extended throughout most of the week as traders shifted their focus from fears of supply disruption in the Persian Gulf to the prospect of additional Iranian barrels returning to the global market. While underlying inventory data remained supportive, the market largely viewed the diplomatic developments as a major bearish catalyst capable of easing supply concerns that had driven prices sharply higher earlier this year.

Iran Agreement Removes Geopolitical Risk Premium

The dominant story for crude oil traders was the rapid progress toward a U.S.-Iran agreement designed to end months of conflict and restore commercial oil flows through the Strait of Hormuz. Reports throughout the week indicated that the agreement would reopen the vital shipping corridor while allowing Iran to resume oil exports under a sanctions waiver framework. Market participants quickly focused on the potential return of Iranian crude exports, significantly improving global supply expectations.

The agreement culminated with the White House sending the text of the interim accord to Congress on June 18. The framework included provisions for reopening the Strait of Hormuz, lifting restrictions on Iranian oil exports, and beginning negotiations toward a longer-term settlement. Traders interpreted the deal as a significant step toward restoring Middle East oil supplies that had been disrupted during the conflict.

As confidence in the agreement increased, crude prices fell toward multi-month lows. Market participants concluded that the probability of a major supply disruption had fallen sharply, prompting widespread liquidation of long positions established during the conflict.

IEA Demand Downgrade Adds Bearish Pressure

Fundamental data released during the week reinforced the bearish reaction to the diplomatic headlines.

The International Energy Agency lowered its 2026 oil demand outlook, citing demand destruction caused by elevated fuel prices and economic disruptions during the Middle East conflict. The agency also noted that a reopening of the Strait of Hormuz could eventually lead to a substantial recovery in global oil supplies. The combination of weaker demand expectations and improving supply prospects encouraged additional selling pressure across crude markets.

The IEA’s report suggested that while inventories remain tight today, the market could move toward a much better-supplied environment if Gulf exports continue normalizing over the coming months. That outlook strengthened the market’s belief that the extreme supply fears seen earlier in the conflict may have peaked.

Tight Inventories and OPEC Outlook Limit Losses

Despite the sharp decline, several supportive factors prevented an even larger selloff.

The Energy Information Administration reported another substantial draw in U.S. crude inventories, with stockpiles falling further during the week. Inventories at the Cushing, Oklahoma delivery hub also continued to decline, highlighting ongoing tightness in physical crude markets and strong refinery demand heading into the summer driving season.

Meanwhile, OPEC maintained its view that global oil demand will continue growing over the longer term and reiterated the need for continued upstream investment to meet future consumption needs. While the market paid little attention to those longer-term projections during the week, they helped reinforce the view that the current selloff was being driven primarily by geopolitical developments rather than a sudden deterioration in underlying oil fundamentals.

Weekly Light Crude Oil Futures

WTI

Trend Indicator Analysis

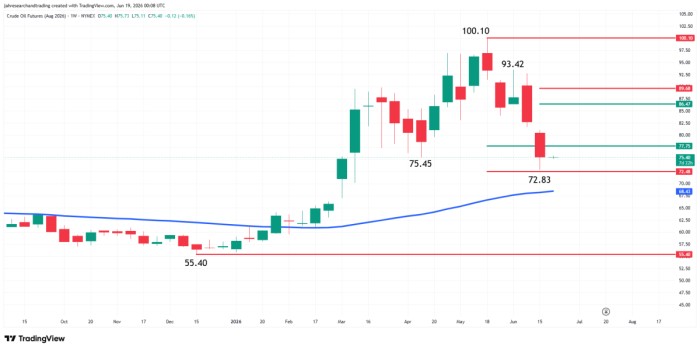
The main trend is down according to the weekly swing. It changed to down when sellers took out $75.45 earlier in the week. This puts the market in “sell the rally” mode.

The long-term range is $55.40 to $100.10. The market is currently sitting inside its 50% to 61.8% zone at $77.75 to $72.48. This is a value area, so it could attract aggressive counter-trend buyers, especially since the 52-week moving average at $68.43 is still holding as long-term support.

The new short-term range is $100.10 to $72.83. If enough buyers come in at $77.75 to $72.48, then a momentum shift could trigger a rebound rally into its retracement zone at $86.47 to $89.58.

Since the main trend is down, sellers should return on a counter-trend rally into $86.47 to $89.58.

The set up for next week is pretty simple. We’re looking for counter-trend buying inside $77.75 to $72.48 and a potential retracement to $86.47 to $89.68 for a fresh shorting opportunity.  

Weekly Technical Forecast

The direction of the Weekly August Crude Oil futures contract for the week ending June 26 is likely to be determined by trader reaction to $77.75.

Bullish Scenario

A sustained move above $77.75 will signal the presence of buyers. This could trigger a strong counter-trend rally into $86.47 to $89.68.

Bearish Scenario

A sustained move under $77.75 will keep the downside pressure on the market. This could lead to a test of $72.48. If that level fails as support then look for the selling to extend into the 52-week moving average at $68.43.

If new buyers don’t come in to support the 52-week moving average then look out to the downside.

Outlook: Supply Recovery Expectations Drive Near-Term Bias

The market’s reaction this week suggests traders are focusing more heavily on future supply recovery than on current inventory tightness.

If the U.S.-Iran agreement continues to advance and the Strait of Hormuz gradually returns to normal operations, additional geopolitical premium could continue to leave the market, keeping downward pressure on crude prices. The prospect of increased Iranian exports remains the key bearish factor. However, inventories remain historically low, and the physical recovery of Middle East exports is expected to take time, limiting the pace of any further declines.

For now, the market appears to be pricing in a successful normalization of oil flows and increasing Iranian exports. Unless negotiations encounter significant obstacles, the near-term outlook remains bearish as traders continue unwinding positions built around fears of prolonged supply disruptions.

Technically, we’re looking for a possible counter-trend rebound from the $77.75 to $72.48 support zone. If it gains traction, the move could possibly extend into retracement zone resistance at $86.47 to $89.68, where selling pressure will be renewed.

We’re also getting close to the 52-week moving average at $68.43. My early assessment is that this indicator could be major support or a trigger point for an acceleration to the downside.