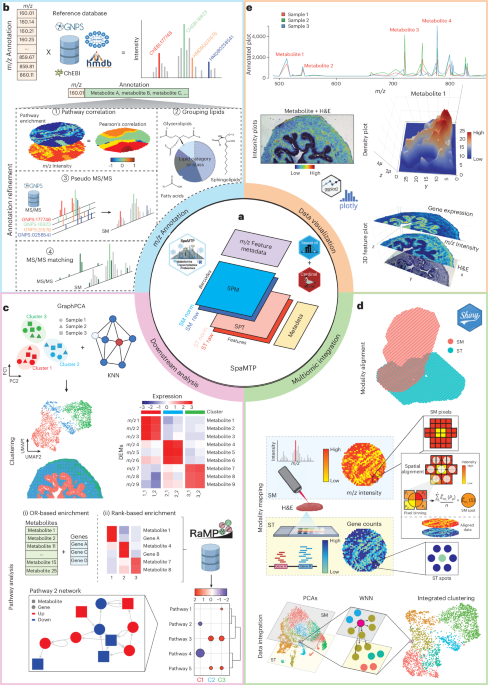
SpaMTP is designed to facilitate a data analysis framework for matched SM and ST data (Fig. 1a). At the core of the package is a standardized data structure that builds on the widely used single-cell analysis Seurat class object16, ensuring efficiency of data operations. Additionally, the data structure provides the ability to retain informative metadata for both spatial locations and features (Fig. 1a). To facilitate flexible environments, data can be loaded in various formats including imaging MS markup language (imzML) files using LoadSM, which expands on Cardinal’s implementation, or as a preprocessed matrix using ReadSM_mtx, enabling preprocessing through other pipelines. SpaMTP also implements various data normalization methods such as library size log normalization and total ion current (TIC) normalization (NormaliseSMData). Quality control of preprocessed data can also be visualized using a range of SpaMTP plotting functions.
While capable of analyzing solely SM data, a unique feature of SpaMTP is the support of integrated multiomics analysis. For optimal multimodal integration, paired SM and ST data from an identical tissue section is preferred; however, SpaMTP can also be used in conjunction with other packages to successfully align paired data from serial sections. SpaMTP inherits functionality from Cardinal and Seurat, whilst also implementing numerous new downstream analysis methods (Table 1).
m/z annotation
The main annotation function of SpaMTP, (AnnotateSM), is able to assign putative metabolite annotations to every valid m/z value, applicable for any data type generated, including TOF data (Fig. 1b). Briefly, public metabolite databases (ChEBI, HMDB, GNPS and LIPIDMAPs) were downloaded, cleaned and standardized using the CompoundDB R package17, including the calculation of 47 common adducts for each neutral mass (Fig. 1b). This reference database can be filtered on the basis of user-defined parameters (for example, polarity, adducts and elemental composition) and exact mass matching for each valid m/z value within a user-specified ppm error range can be performed. Note that all possible isomers are reported for each match, consistent with a Metabolomics Standards Initiative level 4 identification18.
Often, a single m/z peak may be assigned to hundreds of potential metabolites or isomers, making interpretation challenging. Therefore, SpaMTP offers four complementary strategies to reduce the number of annotations per m/z value (each with user-defined parameters to control filtering):
CalculateAnnotationStatistics: This function improves metabolite annotation by incorporating pathway-level correlations derived from spatially resolved omics data (Extended Data Fig. 7). Briefly, for a given m/z, matching intensity values are assigned to each possible metabolite annotation. Depending on the available data (that is, metabolite-only or integrated multiomic data), a normalized and scaled pathway enrichment matrix is generated on the basis of the mean abundance values of all matching analytes corresponding to a given pathway. Then, for each annotated metabolite, Pearson correlation values are calculated for each associated pathway on the basis of its colocalization with the queried m/z intensity. The highest correlation and number of significant pathways per annotated metabolite are then used to calculate a heuristic P value and adjusted P value to rank the most likely metabolite for each m/z mass. Therefore, metabolite annotations that show strong correlations and are associated with numerous pathways are prioritized, providing biologically contextual support for annotation and reducing false positives.
RefineLipids: This function addresses the ambiguity of lipid identification, where a single m/z value can correspond to thousands of possible metabolites because of lipid structural complexity and MS limitations19. Building on rgoslin, m/z values are classified and summarized into major classes using standard lipid nomenclature (Fig. 1b). Annotated lipids are grouped into general categories (for example, glycerolipids and sphingolipids), subclasses (for example, diacylglycerols, triacylglycerols and phosphatidic acid) and refined species19. This also enables intensity binning of similar lipid types, supporting the evaluation of their collective biological roles rather than as individual features (Fig. 1b).
Pseudo_msms: Based on ms1-id20, we implement an annotation strategy that combines correlation-based feature clustering with reverse spectral matching to use in-source fragments for structural annotation. These in-source fragments are formed during the ionization process, before the molecule enters the collision cell.
Compare_msms: When retention time data are available (for example, from liquid chromatography–MS or MS/MS), this function can serve as an orthogonal validation method to assess the accuracy of metabolite annotations, thereby increasing confidence in annotation results.
Matched annotation and additional parameters are individually stored in the SpaMTP m/z metadata slot (Fig. 1a), providing the ability to query, label, combine and plot metabolite expression directly by name.
In the analysis of mouse bladder urothelium region, many of the DE metabolites were lipids (Fig. 2d). Because of their molecular structure (long carbon chains), a key issue when handling lipids is the excessive numbers of possible annotated metabolites associated with one m/z mass (Supplementary Table 3). To simplify these annotations, we used SpaMTP’s lipid nomenclature functionality to refine the original annotation. These simplified annotations highlighted the large number of glycerolipids expressed within the urothelium, particularly PC and PE lipids (Fig. 2e), consistent with previous work11.
SpaMTP’s metabolite annotation performance
We compared the performance of SpaMTP and METASPACE using a publicly available benchmarking dataset containing seven spiked-in metabolites at defined spatial locations20. SpaMTP was the only method to correctly identify all metabolites, whereas METASPACE misannotated two peaks corresponding to glutathione (Extended Data Fig. 1). Further application of SpaMTP’s CalculateAnnotationStatistics function eliminated false positives entirely, achieving perfect recall (Extended Data Fig. 7).
Spatially and interpretably map pixels to a low dimensional space for clustering
Many spatial omics pipelines, including SpaMTP, facilitate the functional interpretation of regional characteristics using principal component analysis (PCA), uniform manifold approximation projection (UMAP) and t-distributed stochastic neighbor embedding. SpaMTP implements a standard PCA pipeline (RunMetabolicPCA) and spatial graph-based PCA (RunSpatialGraphPCA), along with providing users the ability to alter the dataset bin size to reduce noise from metabolic signal mapped to tissue. To interpret clustering of spatial tissue bins on the basis of metabolic signal, SpaMTP effectively implements established Seurat functions16. SpaMTP also incorporates spatially informed PCA analysis (RunSpatialGraphPCA) using methods established by the Python package GraphPCA21,22. In combination, these functions can be executed to identify spatial tissue regions with similar metabolic landscapes and biological signatures, inferred from metabolic data.
Pseudobulking metabolite signals for differential abundance analysis
One key analysis method for SM data is the ability to compare the abundance levels of metabolites across spatial regions. Using similar approaches to bulk and single-cell transcriptomics, here, we implement a function to perform random pooling and pseudobulking to uncover differentially expressed metabolites (FindAllDEMs)23. Briefly, pixels in spatial regions will be randomly divided into n number of pools, with default n = 3 suggested, and their relative intensity values for each m/z are summed (pseudobulking). Using EdgeR, pseudobulked intensity values for each metabolite are then compared for differential abundance24, supporting both simple and complex experimental designs. This pseudobulking analysis results in artificially deflated P values, yet this method is more robust and scalable method than testing using all pixels. In addition, for each m/z value, statistics are calculated, permitting the use of visualization methods.
Integrated pathway analysis of enriched metabolites and transcriptional information
SpaMTP incorporates three principal classes of enrichment analysis that can use metabolite abundance, gene expression or both modalities simultaneously: (1) overrepresentation-based pathway analysis (ORA) (FishersPathwayAnalysis); (2) rank-based enrichment analysis (FindRegionalPathways); and (3) feature set coregulation analysis (RunRAMPgeseca). These pathway approaches differ in their complexity, with ORA representing the simplest and fastest method based on Fishers’s exact test or chi-square test25. Rank-based enrichment analysis instead also accounts for the magnitude and direction of changes in analyte abundance, allowing users to identify pathways differentially expressed between groups of interest26. Lastly, feature set coregulation analysis identifies feature sets that display strong coregulation on the basis of variance across all samples or cells27. In addition, SpaMTP performs multimodal network-based enrichment analysis (PathwayNetworkPlots), implementing an enrichment map to integrate both metabolite and gene expression values to generate an interactive network visualization of analyte interactions28. To implement these analyses, SpaMTP leverages 53,952 pathway databases available through RaMP-DB29,30.
Multimodal pathway analysis benchmarking
We evaluated the performance of SpaMTP’s pathway enrichment analysis against existing tools for bulk data (MetaboAnalyst and Ingenuity Pathway Analysis (IPA))31,32. We used input data containing metabolites and genes from differential expression results comparing the intact and lesioned striatum (Supplementary Table 4). SpaMTP identified the highest number of significant pathways (164) compared to IPA (44) and MetaboAnalyst (0) (Extended Data Fig. 4a,b). Only SpaMTP uncovered pathways associated with dopamine metabolism. To assess whether multimodal analysis revealed information missed by single-modality approaches, we compared pathway outputs in two settings. In the Parkison mouse model, SM alone detected 50 pathways differentially expressed between intact and lesioned striatum and ST alone detected 332, whereas SpaMTP’s combined multimodal approach identified 892 (Extended Data Fig. 4a,b). A total of 539 pathways were exclusively detected with the multimodal approach, including biologically relevant pathways, such as dopaminergic synapse and dopamine neurotransmitter release cycle. Similarly, in the IDH-mutant glioma sample, 173 pathways were identified from SM alone to be differentially expressed between tumor and adjacent normal, 11 were identified from ST alone and 181 were identified through integration (Extended Data Fig. 4a,b). Of these, 22 were unique to the combined approach, including fumarate metabolism, consistent with known IDH-driven metabolic rewiring (Extended Data Fig. 4a,b). These findings highlight SpaMTP’s ability to extract biologically meaningful, spatially contextualized pathways by leveraging multimodal data integration.
Multimodal alignment
This package is optimally designed to combine SM data with spatial data from other omics technologies, such as ST data. While prealigned data can be loaded directly, SpaMTP also provides two functions that allow for the manual alignment (AlignSpatialOmics) and mapping (MapSpatialOmics) of spatial multiomics data to the same common coordinate system (Fig. 1d).
Briefly, AlignSpatialOmics provides an interactive platform for aligning spatial coordinates between modalities to a common system (Extended Data Fig. 8). Following this, the MapSpatialOmics function processes both modalities by first generating polygon objects for each SM pixel and ST spot. This is achieved by expanding the centroided pixel coordinate values by the median distance between neighboring pixels or by a prespecified size. According to the radius of each ST spot, all polygons that overlap are assigned to their respective spot. In cases where multiple pixels are assigned to a single spot or cell, the mean intensity value for each m/z mass is allocated. Using Seurat’s assay class design, the common spatial coordinate system is matched to a transcriptomics (‘SPT’) and metabolic (‘SPM’) assay, containing raw gene count and metabolite intensity values respectively (Fig. 1a). This results in a single SpaMTP object storing data values from both modalities. This principle can be flexibly applied for integrating any further spatial modality (that is, spatial proteomics data).
SpaMTP provides various functions for analyzing multimodal data including spatial correlation analysis of both genes and metabolites simultaneously. Additionally, cross-modality integration can be performed to generate informative clusters on the basis of similar transcriptional and metabolic patterns (Fig. 1d). Data integration is executed using weighted nearest neighbors (WNN) implemented by Seurat16 using embedding generated by SpaMTP’s GraphPCA, which helps to preserve both global and local relationships in the data. WNN allows the user to adjust modality weighting (default weighting of 0.5 for SM and ST) according to biological rationale (Extended Data Fig. 9). This data integration can improve the clustering performance by more accurately detecting biologically meaningful cell clusters.
Visualization of spatial metabolic and multimodal data
SpaMTP provides a wide range of visualization methods and interactive tools to intuitively display different biological results (Fig. 1e). To visualize pathway analysis results, SpaMTP provides a ggplot2-based dot plot to assess enrichment elements, P values and Jaccard distances between enriched pathways (PlotRegionalPathways) and the VisualisePathways function generates an expression plot alongside each pathway (Figs. 1c and 2k–m). These visualizations are further enhanced by quantitative colocalization metrics such as Moran’s I (FindSpatiallyVariableMetabolites) and Pearson correlation (FindCorrelatedFeatures), which support spatial interpretation of multimodal molecular patterns.
For visualizing the expression levels of individual mass-to-charge peaks, SpaMTP offers tools for summarizing mass intensity and spatial intensity plots interactively. This functionality is provided with two interactive tools, Plot3DFeatures and DensityPlot, which provide a 3D visualization (Fig. 1e), either displaying multilayered metabolite or gene expression or the density of a metabolite intensity across spatial coordinates. For this, in SpaMTP, we implement a Gaussian kernel density estimation through Javascript’s library with an unbiased cross-validation for bandwidth parameters. These functions can help enhance the interpretability of spatially significant peaks and multimodality-based correlations.
Runtime and memory usage
We performed benchmarking of SpaMTP’s main functions to assess runtime and memory usage (Extended Data Fig. 10). Metabolite annotation and multiomics integration in SpaMTP scaled efficiently with dataset size (up tp 5,000 metabolites, 150,000 spatial bins). GraphPCA required more computational resources. To further reduce memory load and computational resources, methods such as Sketch-based PCA can be applied in SpaMTP (Extended Data Fig. 10).
Downstream analysis of the murine urinary bladder dataset
To demonstrate the capabilities of a SpaMTP-based SM analytic pipeline, we first analyzed a commonly used metabolomics benchmarking dataset, the mouse urinary bladder dataset21 (Fig. 2b). We first performed spatially aware shrunken centroid (ssc) clustering (Fig. 2b). This generated segments that aligned to defined tissue regions including the urinary bladder muscle (cluster 2), adventitial layer (cluster 5) and urothelium (cluster 6). Next, we performed differential abundance analysis for metabolites across each of these three clusters. We found 70 differential abundant metabolites, some of which have been reported as biologically important (for example, PC(34:1), SM(34:1) and PC(30:2)). As many of the differentially expressed metabolites were lipids, we used SpaMTP’s lipid nomenclature grouping functionality to refine the original annotation (Table 1). The grouping functionality determined categories and classes of lipids that were differentially expressed within the urothelium, particularly PC and PE lipids (Fig. 2e), consistent with previous publications identifying high levels of lipids present within the urothelium of humans11.
As an alternative to common ssc clustering, SpaMTP provides an interpretable metabolite-based PCA analysis tool that works in conjunction with Seurat’s in-built graph-based clustering methods (for example, FindClusters). SpaMTP clustering identified a new cluster, corresponding to the lamina propria. SpaMTP’s colocalization analysis between metabolite distribution and spatial cluster labels identified metabolite markers for the new cluster (Fig. 2f). To further interrogate these results, we performed pathway analysis. SpaMTP pathway analysis revealed Gα-associated signaling pathways and sensory perception pathways. Outside of the urothelium, regions such as the adventitia (cluster 4) and lamina propria displayed increased sphingolipid metabolism12. The identification of these region-specific pathways demonstrates the ability of SpaMTP to identify deeper biological processes, which are lacking in most other SM packages (Table 1).
Integration and analysis of multiomics Parkinson mouse dataset
We used a public Parkinson mouse brain dataset containing paired MALDI-TOF and 10X Visium data generated from the same tissue section. Here, we also individually analyzed two different MALDI matrices each with paired Visium data (FMP-10 and DHB matrices)29. SpaMTP can handle and annotate any MALDI matrix. This includes FMP-10 data, whereby predefined metabolite annotations were assigned to corresponding m/z values using SpaMTP’s AddCustomAnnotation function. Using SpaMTP, all modalities were aligned. The spatial distribution patterns of each metabolite were unaffected by the alignment process, demonstrated by the comparison between spot-binned and original raw pixel expression values for dopamine (Fig. 2h). Both modalities were integrated with SpaMTP through an optimized Seurat-based WNN function (MultiOmicIntegration) using equal modality weightings (metabolite/gene = 0.5/0.5). The resulting integrated clusters were further characterized using SpaMTP’s pseudobulking differential expression analysis. The integrated clusters revealed that both FMP-10-derivatized dopamine molecules (single and double derivatized) were upregulated in cluster 2 compared to all other clusters (Fig. 2j). In addition, differential gene expression analysis across all integrated clusters revealed multiple genes, including Pcp4, associated with the metabolic state of the intact striatum. These genes were unidentifiable when analyzing purely ST-based clustering results. Pairs of metabolites and genes, such as dopamine and Pcp4, can be visualized in a 3D plot to clearly observe region-specific correlations between modalities (Fig. 2k).
To assess the multimodal clustering, we calculated various metrics associated with dopamine abundance within the cluster corresponding to the intact striatum and compared clustering methods, with or without integration (Extended Data Fig. 3). Across almost all metrics, SpaMTP integrated clustering outperformed all other clustering methods. These results collectively highlight the benefit of integrating data from different modalities.
Biological pathways involve interactions between molecular compounds across different biological modalities. In analyzing the effects of striatal lesions in the mouse brain, the integration of differentially expressed metabolites and genes using SpaMTP revealed significant alterations in several neurological pathways (Fig. 2l). SpaMTP’s joint analyses identified the dopamine β-hydroxylase deficiency pathway in the context of oxidative stress, highlighting the roles of SAM and D-dopachrome. SpaMTP’s network visualization tool (PathwayNetworkPlots) displays altered expression of individual genes and analytes within this pathway and metabolites with a key role in this understudied mechanism of dopamine downregulation (Fig. 2m). The interplay of regulation mechanisms across different modalities highlights the potential explanation of dopamine dysregulation following striatal damage.
Single-cell resolution multiomics integration of glioma dataset
To demonstrate SpaMTP’s capabilities with single-cell resolution data, we applied it to an IDH-mutant glioma sample, where serial sections were profiled using 10X Xenium ST, MALDI-TOF SM and post-Xenium immunofluorescence staining (Extended Data Fig. 5). The spatial domain spanned from the tumor core to adjacent normal tissue, enabling the examination of tumor infiltration and the cellular leading edge. Cell-morphology-based segmentation of the 10X Xenium ST data was combined with precise spatial alignment to MALDI MSI. We showed that the fumarate metabolism pathway could only be identified by multimodal integration (Extended Data Fig. 4). Similarly, the integrated data had higher detection sensitivity for glycolysis and neuronal pathways than unimodal analysis.
Reporting summary
Further information on research design is available in the Nature Portfolio Reporting Summary linked to this article.