
The morphological structure of LDH and the LDH–AC composite was examined, as illustrated in Fig. 1. The figure shows that LDH has a micro-sized structure averaging approximately 33 μm, with fine particles aggregating to form larger particles of about 110 μm. Figure 1(a) shows that LDH and its composite have semi-hexagonal sheets. LDH particles were prepared with AC layers, yielding a well-designed porous material (Fig. 1(b)). The LDH–AC has a lower particle size of about 12 μm because LDH and AC are mixed. This is consistent with the findings reported in the literature33.

SEM images for the synthesized (a) LDH and (b) LDH–AC.
FT–IR analysis was employed to ascertain the molecular structure of the synthesized material (LDH) and to validate the interaction between LDH and AC. We found the functional groups in LDH, LDH-MO, LDH-AC, and LDH-AC-MO. Figure 2 shows the spectrum that came out of this. In the high-frequency range, two separate absorption bands show up about 3380 cm⁻¹. These bands are due to the stretching vibrations of interlayer water hydroxyl groups (O–H) and magnesium–iron–bound hydroxyl groups of hydrotalcite for all samples. The O–H bending vibration characteristic peaks of water molecules trapped between the layers and surfaces of LDHs may be observed at 1646 cm− 1. The C–O band of AC was seen at 1002 cm− 1. This showed that the C–O of AC and the LDH were interacting at the molecular level32. The COOH group of AC transformed into a carboxylate, and the free OH absorption band of LDH became hydrogen-bound, indicating the intercalation of AC into LDH layers 34,35, as seen in Fig. 2. There is a sharp peak at 1380 cm− 1 because MO is chemisorbed on LDH and LDH–AC. This is shown by functional groups such as –COO that sorb MO via collateral interactions, electrostatic interactions, and ion exchange36.
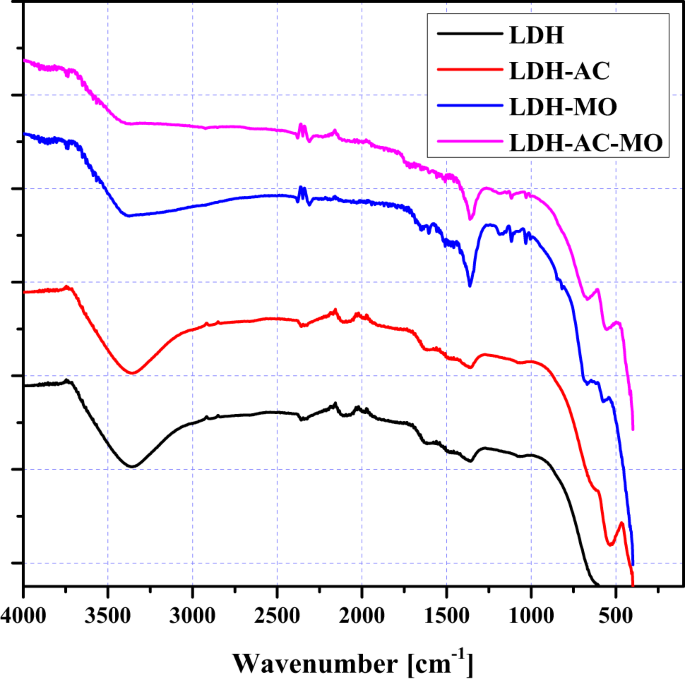
FT–IR spectra for LDH, LDH–AC, LDH–MO, and LDH–AC–MO.
The X-Ray spectra of the synthesized LDH and LDH-AC are shown in Fig. 3. The peak positions (2θ) at 11.75°, 23.44°, and 34.43° corresponded to the (0 0 3), (0 0 6), and (0 0 9) planes of LDHs, with d values of 7.52, 3.79, and 2.60, respectively. These were characteristic peaks of crystalline LDHs37, as shown in Fig. 3(a). Figure 3(b) shows the X-ray spectra of the LDH-AC composite. The typical reflections of LDH were amplified, indicating the production of a mixture of pure LDH and intercalated LDH. This shows that the AC-intercalated LDH structure has formed.

XRD pattern of (a) LDH and (b) LDH–AC.
BET analysis revealed specific surface areas of 23.49 m²/g for LDH and 19.81 m²/g for LDH–AC. The decrease in the surface area is attributed to the impregnation of activated carbon particles into the interlayer galleries and onto the external surfaces of LDH, causing partial pore blockage and aggregation that reduces accessible microporosity. This confirms the results obtained above from SEM. Such behavior is consistent with LDH composite formation, where high surface area of AC integrates but does not fully dominate due to intimate LDH-AC interactions, including hydrogen bonding and van der Waals forces that smoothen the composite texture. Despite the lower BET area of LDH–AC, it exhibited markedly superior methyl orange sorption capacity, suggesting compensatory mechanisms: enhanced active sites from functional groups of AC (such as –OH, –COOH), improved hydrophobicity aiding dye diffusion.
The point of zero charge (pHPZC) is the pH at which the LDH–AC surface charge is neutral; -ve charges exist above this point, while +ve charges occur beyond. A set of 50 mL bottles with 0.1 g of LDH–AC and 10 mL of an electrolyte (KNO3) at 0.1 mol/L were used for the computation. The original pH of the bottles ranged from 2 to 10, and they were agitated for a full day. The final pH (pHfinal) was measured in each case after the centrifugation. Plotting initial pH (pHinitial) against ∆pH (pHfinal-pHinitial), as shown in Fig. 4. The pHPZC was found to be 8.75. As a result, the LDH–AC surface becomes positive charged at pH values lower than 8.75, which increases its capacity to adsorb anions (MO) throughout a wide pH range.
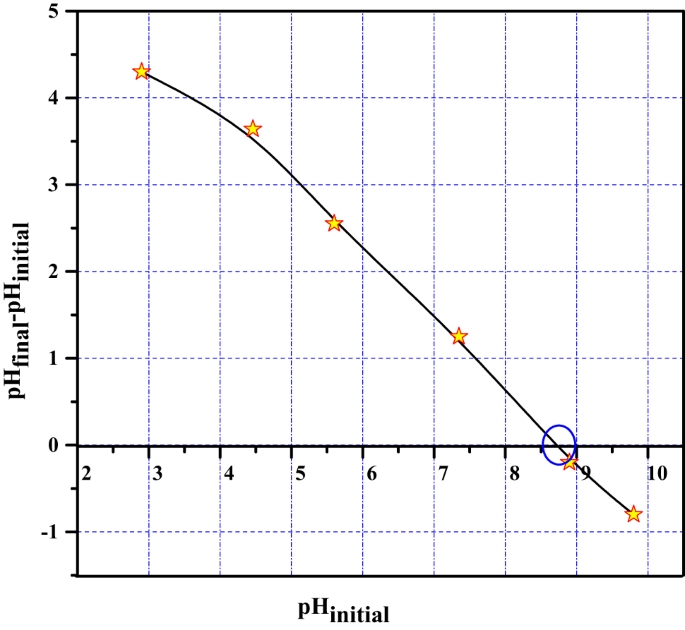
Studying the point of zero charge of LDH–AC.
Sorption experimentsEffect of pH
Figure 5 shows that both LDH and LDH–AC sorb methyl orange less as pH increases. This could be because of the surface charge. The protonation process on the sorbent materials’ surfaces has left many positively charged binding sites on both materials38. Sorption occurs due to electrostatic attraction between the anion and the positive charge on the surfaces of both materials39. As the pH increased, the negative charge density on the sorbet surface increased, reducing the electrostatic attraction force. This made it harder for the negatively charged MO ions to stick to the sorbet. The optimal pH for MO sorption is 5.5, yielding a high R% and a moderate pH. The R% value for LDH–AC (92%) is also higher than that for LDH (72%), indicating that the modification method improved sorption efficiency.

Effect of pH on sorption of 100 mg/L of MO by 0.03 g of (a) LDH and (b) LDH–AC, at 298 K and equilibrium time of 60 min.
Effect of sorbent mass
The sorbent dose is an important parameter in sorption studies because it indicates how much of a given initial ion concentration the sorbent can retain. It is also important to look into the effect of sorbent mass to find the best sorbent mass by balancing the sorbent capacity and the R% of MO40. Figure 6 shows how the sorbent mass, ranging from 0.01 to 0.03 g, affects the results. As the LDH and LDH–AC mass went up from 0.01 g to 0.03 g, the R% of MO went up from 35% to 76% for LDH and from 72% to 95% for LDH–AC. When the amount of sorbent was raised from 0.01 to 0.03 g, the amount of sorbed (qe) dropped from 35 to 25.3 mg/g for LDH and from 72 to 31.7 mg/g for LDH–AC. This is because there are more places and surfaces for the sorption to happen when the mass is greater. The fact that the sites remain unsaturated during sorption is what causes the amount sorbed to decrease 40,41. To determine the optimal amount of sorbent, you need to perform a trade-off analysis between sorption capacity and R%. The best amount of ion removal and sorbed mass is 0.03 g for both types of sorbents.

Effect of sorbent mass on sorption of 100 mg/L MO by (a) LDH and (b) LDH–AC at 298 K, pH 5.5 and 60 min equilibrium time.
Effect of shaking time
The shaking duration was analyzed for the sorption of methyl orange by both LDH and LDH–AC at pH 5.5 over 2-120 min. Figure 7 shows that the clearing percentage increased with increasing shaking period. It reached its maximum at the equilibrium time, and after that, there was almost no further sorption. Figure 7(a) shows that the equilibrium time for MO is reached after 20 min for LDH. Figure 7(b) shows that the equilibrium time for LDH–AC is increased to 60 min. However, since the R% values for LDH–AC are higher than those for unmodified LDH, the modification method improves sorption.
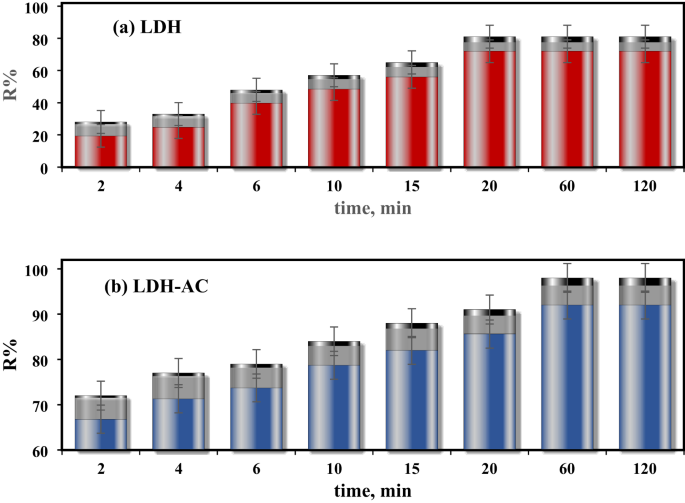
Effect of shaking time on sorption of 100 mg/L MO by 0.03 g of (a) LDH and (b) LDH–AC at 298 K and pH 5.5.
Pseudo–first–order model
Kinetic models can provide information on how sorption occurs and which mechanisms may be involved. They are also very important for designing the sorption system and developing the process. Lagergren42 put forward the pseudo-first-order kinetic model (PFO). The Lagergren rate equation describes the sorption rate from aqueous solution and can be expressed as follows.
$$\frac{{d{q_t}}}{{dt}}={k_n}{\left( {{q_e} – {q_t}} \right)^n}$$
(4)
where qe and qt are the amounts of sorbed material at equilibrium and time t (mg/g), respectively. The rate constant is identified by kn and n is the sorption reaction order. If n equals 1, integrated form of Eq. (1) for the boundary conditions qt = 0 when t = 0, will give the PFO formula as follows.
$${q_t}={q_e} \left( {1 – e^{ – {k_1}t}} \right)$$
(5)
k1 (min− 1) is the rate constant for PFO theory. It is usually noted that kinetics follows Lagergren equation when the sorption performs over diffusion in the interface43,44. Applying the nonlinear fitting by plotting of qt vs. t is explored in Fig. 8. Table 1 reported the computed values of k1 and qe along with the regression coefficient, R2, of the PFO. Despite the computed qe values are near to the experimental values, the R2 values are very low for both materials; hence, this model does not capture how MO was adsorbed by either LDH or the LDH–AC composite.

Pseudo-first-order for sorption of 100 mg/L MO by 0.03 g of (a) LDH and (b) LDH–AC at different temperatures and pH 5.5.
Pseudo–second–order model
The pseudo–second–order (PSO) model posits that the rate-determining phase of the process may involve chemisorption44, necessitating an electron valency force or electron exchange between the sorbent and the sorbate and probably the formation of a new compound41. From Eq. (1), PSO can be obtained if n equals 2,. The differential equation of the model is formulated as:
$$\frac{{d{q_t}}}{{dt}}={k_2}{\left( {{q_e} – {q_t}} \right)^2}$$
(6)
k2 (g/mg min− 1) denotes the PSO rate constant for the sorption process. Integrating and applying boundary conditions qt=0 when t = 0 and qt=qt when t = t, Eq. (6) is changed to be as follows
$${q_t}=\frac{{{k_2}q_{e}^{2}t}}{{1+{k_2}{q_e}t}}$$
(7)
k2 and the calculated amount sorbed, qe, calc, can be gained from the nonlinear plot of qt vs. t, Fig. 9. The data demonstrated that R2 values of PSO are higher than that of PFO, Table 1. Moreover, the computed values of qe, calc from the PSO are more close to the qe, exp. Hence, the PSO is more likely to determine the sorption over the whole range of time; it also indicates the chemisorption process. So, the PSO is better fit the data than the PFO on the sorption of MO by the prepared material.

Pseudo–second–order plot for sorption of 100 mg/L MO by 0.03 g of (a) LDH and (b) LDH–AC at different temperatures and pH 5.5.
Intra-particle diffusion model
The examination of Mores and Weber’s theory revealed that film diffusion exerts negligible influence during sorption; hence, intra-particle diffusion governs the process’s rate45. Mores and Weber developed an equation based on their own ideas.
$$q_t = k_{ad} t^{1/2} + C$$
(8)
The rate constant for intra-particle diffusion is kad (mg g− 1 min− 1/2), and the constant C is directly related to boundary films. An elevated C value signifies enhanced boundary films. We examined how the amount of sorbed material changed over time (qt vs. t½) to understand better the distinct stages of mass transfer in Fig. 10. The boundary-film diffusion stage occurred quickly because it didn’t affect the reaction rate; therefore, the researchers omitted it from the figure. The next phase, on the other hand, was the slowest in the gradual sorption process.
The sorption of MO onto LDH and LDH–AC transpired via film and intra-particle diffusion, with intra-particle diffusion emerging as the predominant mechanism governing MO sorption behavior. The sorbate moves by going from the bulk solution into the pores of the sorbent. Table 1 shows the values of C. Intra-particle diffusion is a major rate-influencing step (multi-linear Weber-Morris plots (high values of R2), but non-zero intercepts indicate concomitant film/boundary layer diffusion. This hybrid diffusion control aligns with the enhanced capacity of LDH–AC despite reduced BET area, as surface chemistry accelerates boundary layer penetration. The film diffusion is a sharp increase (fast step) while the intra-particle diffusion is the slowest step so, the intra-particle diffusion was selected as the rate determining step.

Plotting of Intra-particle diffusion model for sorption of 100 mg/L MO by 0.03 g of (a) LDH and (b) LDH–AC at different temperatures and pH 5.5.
Equilibrium isotherm studies
Different theoretical models, such as Langmuir, Freundlich, and D-R, can be used to examine both sorption capacity and the processes involved in MO sorption by LDH and LDH–AC.
Langmuir isotherm
Different sorbents use the Langmuir model because it was first used for systems that adsorb gases and solids, it was modified to fit the adsorption isotherm of liquid on solid surfaces46. The model demonstrated that both adsorption and desorption terminate at the surface, as kinetic principles govern equilibrium47. To assess sorption capacity, different concentrations of MO solutions were agitated with LDH and/or LDH–AC for a specified equilibrium duration. The nonlinear form of Langmuir theory is identified as follows.
$$q_e = q_m \frac{K_L C_e}{1+ K_L C_e}$$
(9)
where qm gives the max sorption capacity, mg/g, and KL in L/mg is the sorption affinity constant. Figure 11 illustrates fitting of the experimental results to the sorption equation by nonlinear regression fitting (qe vs. Ce). Table 2 reports values of Langmuir constants; the qm of MO ions sorbed by LDH and LDH–AC are 71.43 and 393.70 mg/g at room temperature, respectively. This suggests that modifying LDH improved its sorption capacity. Equation (10) was used to figure out the RL values for both sorbents. They are between 0 and 1, indicating good sorption. In particular, the RL values for LDH (0.493) and LDH–AC (0.383) suggest that the sorption process worked well at the examined doses.
$$R_L =\frac{1}{1+bC_o}$$
(10)

Langmuir plot for sorption of MO by 0.03 g of LDH and LDH–AC at 298 K and pH 5.5.
Freundlich isotherm theory
The sorption was also described using the Freundlich isotherm, which accounts for sorption on surfaces that are not uniform. This theory is often used in places where multilayer sorption and surfaces with varying affinities happen. Freundlich theory is non-linearly formulated by Eq. (6).
$${q_e}={K_F}C_{e}^{{{\raise0.7ex\hbox{$1$} \!\mathord{\left/ {\vphantom {1 n}}\right.\kern-0pt}\!\lower0.7ex\hbox{$n$}}}}$$
(11)
Identifying Freundlich constants using n and k. The constant k shows how much the sorbent can hold, whereas the value of 1/n gives how strong and sufficient the sorbent/sorbate system is. Figure 12 explores the non-linear plot of qe against Ce and the values of Freundlich parameters are reported in Table 2. Both LDH and LDH–AC exhibit concentration-dependent MO sorption, as indicated by 1/n values less than 1. The table shows that the R2 values are higher than those predicted by Langmuir theory (R2 > 0.9). So, the Freundlich isotherm is better for MO sorption by LDH and LDH–AC.

Freundlich non-linear plot for sorption of MO by 0.03 g of LDH and LDH–AC at 298 K and pH 5.5.
Dubin–Radushkevich (D–R) isotherm
The Dubinin–Radushkevich theory posits that the porous structure of the sorbent influences the shape of the sorption curve. The sorption data were analyzed using the D–R theory to distinguish between chemical and physical adsorption48. It also specifies the sorption type as ion-exchange or physical adsorption. It is relevant at low concentrations and can be used to characterize sorption on both homogeneous and heterogeneous surfaces. Sorption is characterized by a singular type of uniform pore. The D–R isotherm is analogous to the Langmuir type but is more general, as it does not presume a homogeneous surface or a constant sorption potential. The non-linear form of D-R formula is expressed by the subsequent equation.
$${q_e}={q_m}{e^{ – \beta {{\left( {RT\ln \left( {1+\frac{1}{{{C_e}}}} \right)} \right)}^2}}}$$
(12)
where qm (mol/g) is the maximum quantity of MO that can be sorbed onto unit weight of the sorbent, and β is the activity coefficient related to mean sorption energy. Polanyi potential, ε, is expressed in (kJ/mol)2, is specified by the following equation.
$$\epsilon = RT In \left( 1+\frac{1}{C_e}\right )$$
(13)
where R is the general gas constant (0.008314 kJ/mol K.), and T is the absolute temperature in kelvin (K).
Plotting the non-linear form of D–R is seen in Fig. 13. Table 2 shows how to find the values of β (mol2/kJ2) and qm (mmol/g). The value of β is connected to the sorption mean free energy, E (kJ/mol), which you can find using Eq. 14 and identified as the change in free energy required to move one mole of sorbate from the solution’s infinity to the sorbent surface.
$$E=\frac{1}{{\sqrt {2\beta } }}$$
(14)
The sorption mechanism, such as ion-exchange or physical adsorption, can be inferred from the mean free energy of sorption, E. Ion-exchange occurs during the sorption process if the E value is between 8 and 16 kJ/mol, whereas physical sorption occurs if the E value is less than 8 kJ/mol48. The findings demonstrated the physical character of the sorption process.

D–R isotherm non-linear plot for sorption of MO by 0.03 g of LDH and/or LDH–AC at 298 K and pH 5.5.
Thermodynamic studies
The thermodynamic parameters (∆Go, ∆Ho, and ∆So) of sorption are important for determining whether a process is endothermic or exothermic, as well as the spontaneity of MO sorption. The thermodynamic coefficients are calculated using the Vant Hoff equation.
$$\Delta {G^o} = – RT \ln {K_d}$$
(15)
where Kd denotes the distribution coefficient, L/g, and ∆Go is the Gibbs free energy change. This is one way to depict the shift in free energy.
$$\Delta {G^o} = – \Delta H^o \cdot T \Delta S^o$$
(16)
The thermodynamic formula is used to compute ln Kd by rearranging and substituting the value of ∆Go from Eq. (15) in Eq. (14) as follows.
$$In K_d = \frac{\Delta S^o }{R}- \frac{\Delta H^o}{R} \frac{1}{T}$$
(17)
Straight lines were obtained from the ln Kd & 1/T plot, as explored in Fig. 14. Entropy (ΔSo) and enthalpy changes (ΔHo) can be calculated using the slope and intercept. Because both LDH and LDH–AC have positive ΔHo values, Table 3 indicates that sorption is endothermic. Furthermore, the sorption mechanism is chemisorption when ΔHo values for LDH–AC are higher than 20 kJ/mol. Because of structural changes in both the sorbent and the sorbate, as well as the sorbents’ affinity for MO, as seen by the positive values of ΔSo, the solid/solution interface provides increased unpredictability. The obtained negative values of ∆Go verify the spontaneous nature and viability of the sorption processes.

Thermodynamics for sorption of MO by 0.03 g of (a) LDH and (b) LDH–AC at pH 5.5.
Proposed sorption mechanism
The molecular structure of the dye, the sorbent’s surface properties, and the conditions of the sorption medium all have impacts on the sorption mechanism of organic dye. Dye sorption can be controlled by a different mechanism, including hydrophobic interaction, hydrogen bonding, and electrostatic attraction, depending on these factors. It is known that the LDH is characterized by the presence of positive charge on the surface, and a negatively charged anion-exchange layer (OH–) in the interlayer area, as mentioned above in the FTIR section. This simplifies the adsorption of anions by ion exchange process such as methyl orange which has a negative charge due to the presence of sulfonate group as illustrated by Scheme 1. In addition, the activated carbon contains negatively charged carboxylate groups (–COO–) which increase the sorption capacity. Based on the experimental findings and considering the molecular structures of MO as well as the surface properties of the LDH–AC, the sorption mechanism maybe also proceed via electrostatic attraction between the negative charge of the dye and the positively charged surface of LDH–AC, as illustrated in Scheme 1. This confirms the suggested mechanism gained from D–R isotherm model which told us that the sorption mechanism may be physical process according to the value of mean free energy. Therefore, MO removal by LDH–AC involves a multi-mechanism process.

Proposed sorption mechanism of MO by LDH–AC at 298 K and pH 5.5
Desorption study
The desorption of methyl orange ions from LDH–AC sorbent was carried out employing both ethyl alcohol and different molarities of sodium hydroxide, ranged from 0.1 to 1.0 mol/L at 298 K for 3 h. The desorption percentages, D%, of MO were computed by measuring the values of MO concentration in the aqueous phase, Ca, and in the solid, Cs, as illustrated in Eq. (17). The results showed that the value of D% was found to be more than 95% using 0.5 mol/L NaOH. This indicates that LDH–AC is capable of regeneration and reuse.
$$D\% =\frac{{{C_a}}}{{{C_s}}} \times 100$$
(18)
Comparison of adsorbents
The results of a comparison of MO’s sorption capacity with modified LDH and other sorbents used in the literature are reported in Table 4. LDH-AC’s strong sorption capacity is demonstrated by its highest sorption capacity compared to previous materials.