Note: At the bottom of this post, paid subscribers can find a methods PDF and an Excel spreadsheet with all data presented in the analysis. It is work in progress — Caveat lector!
In 1995 Jesse Ausubel published “Technical Progress and Climatic Change” which was perhaps the very first paper to identify the flawed assumptions that would more than 30 years later lead to the retirement of the RCP8.5 scenario.
Ausubel wrote about technological trajectories — computing speed, aircraft engines, corn yields, lamp efficiency — and argued that these evolve at rates steady enough over many decades that we can say useful things about the technological world of 2100.
For projecting future energy trajectories, Ausubel chose decarbonization — which he defined as the long decline in the carbon intensity of primary energy since 1900, which occurred “without gloomy climate forecasts or dirty taxes.”
With the figure above, Ausubel compared historical decarbonization to the IPCC 1990 “Business as Usual” (BAU) scenario, which halted that decline and reversed it. He wrote:
“Business as Usual” was a scenario of technical regression. It essentially ignored the scientific and technical achievement of the past 300 years.
Ausubel had already made this objection as a reviewer of the first IPCC report, where he called the scenario “Brezhnevite.”
The IPCC did not accept Ausubel’s 1990 critique, but in 2026 it seems that climate research has finally caught up to Jesse.
As Ausubel wrote this May,
It’s good to see the lunatic BAU and 8.5 scenarios put in their proper place, if only after 35 years and a lot of harm. All this was in the open literature. Science is not always scientific.
The integrated assessment model outputs of the new generation of climate scenarios was released last week, and if past is prologue, the focus of research and policy will be on the most extreme scenario available — named CMIP7 HIGH.
The committee that created the new scenarios explain that they wanted HIGH to be “as high as plausible.”
Fair enough.
But since that committee did not release any formal analysis of plausibility, let’s perform that exercise today here at THB.
Grab a hot beverage and settle in — this is a fun one, but also wonky and detailed.
The first thing I did was to rebuild Ausubel’s figure above from 1900 and extended it to 2024, then added HIGH.
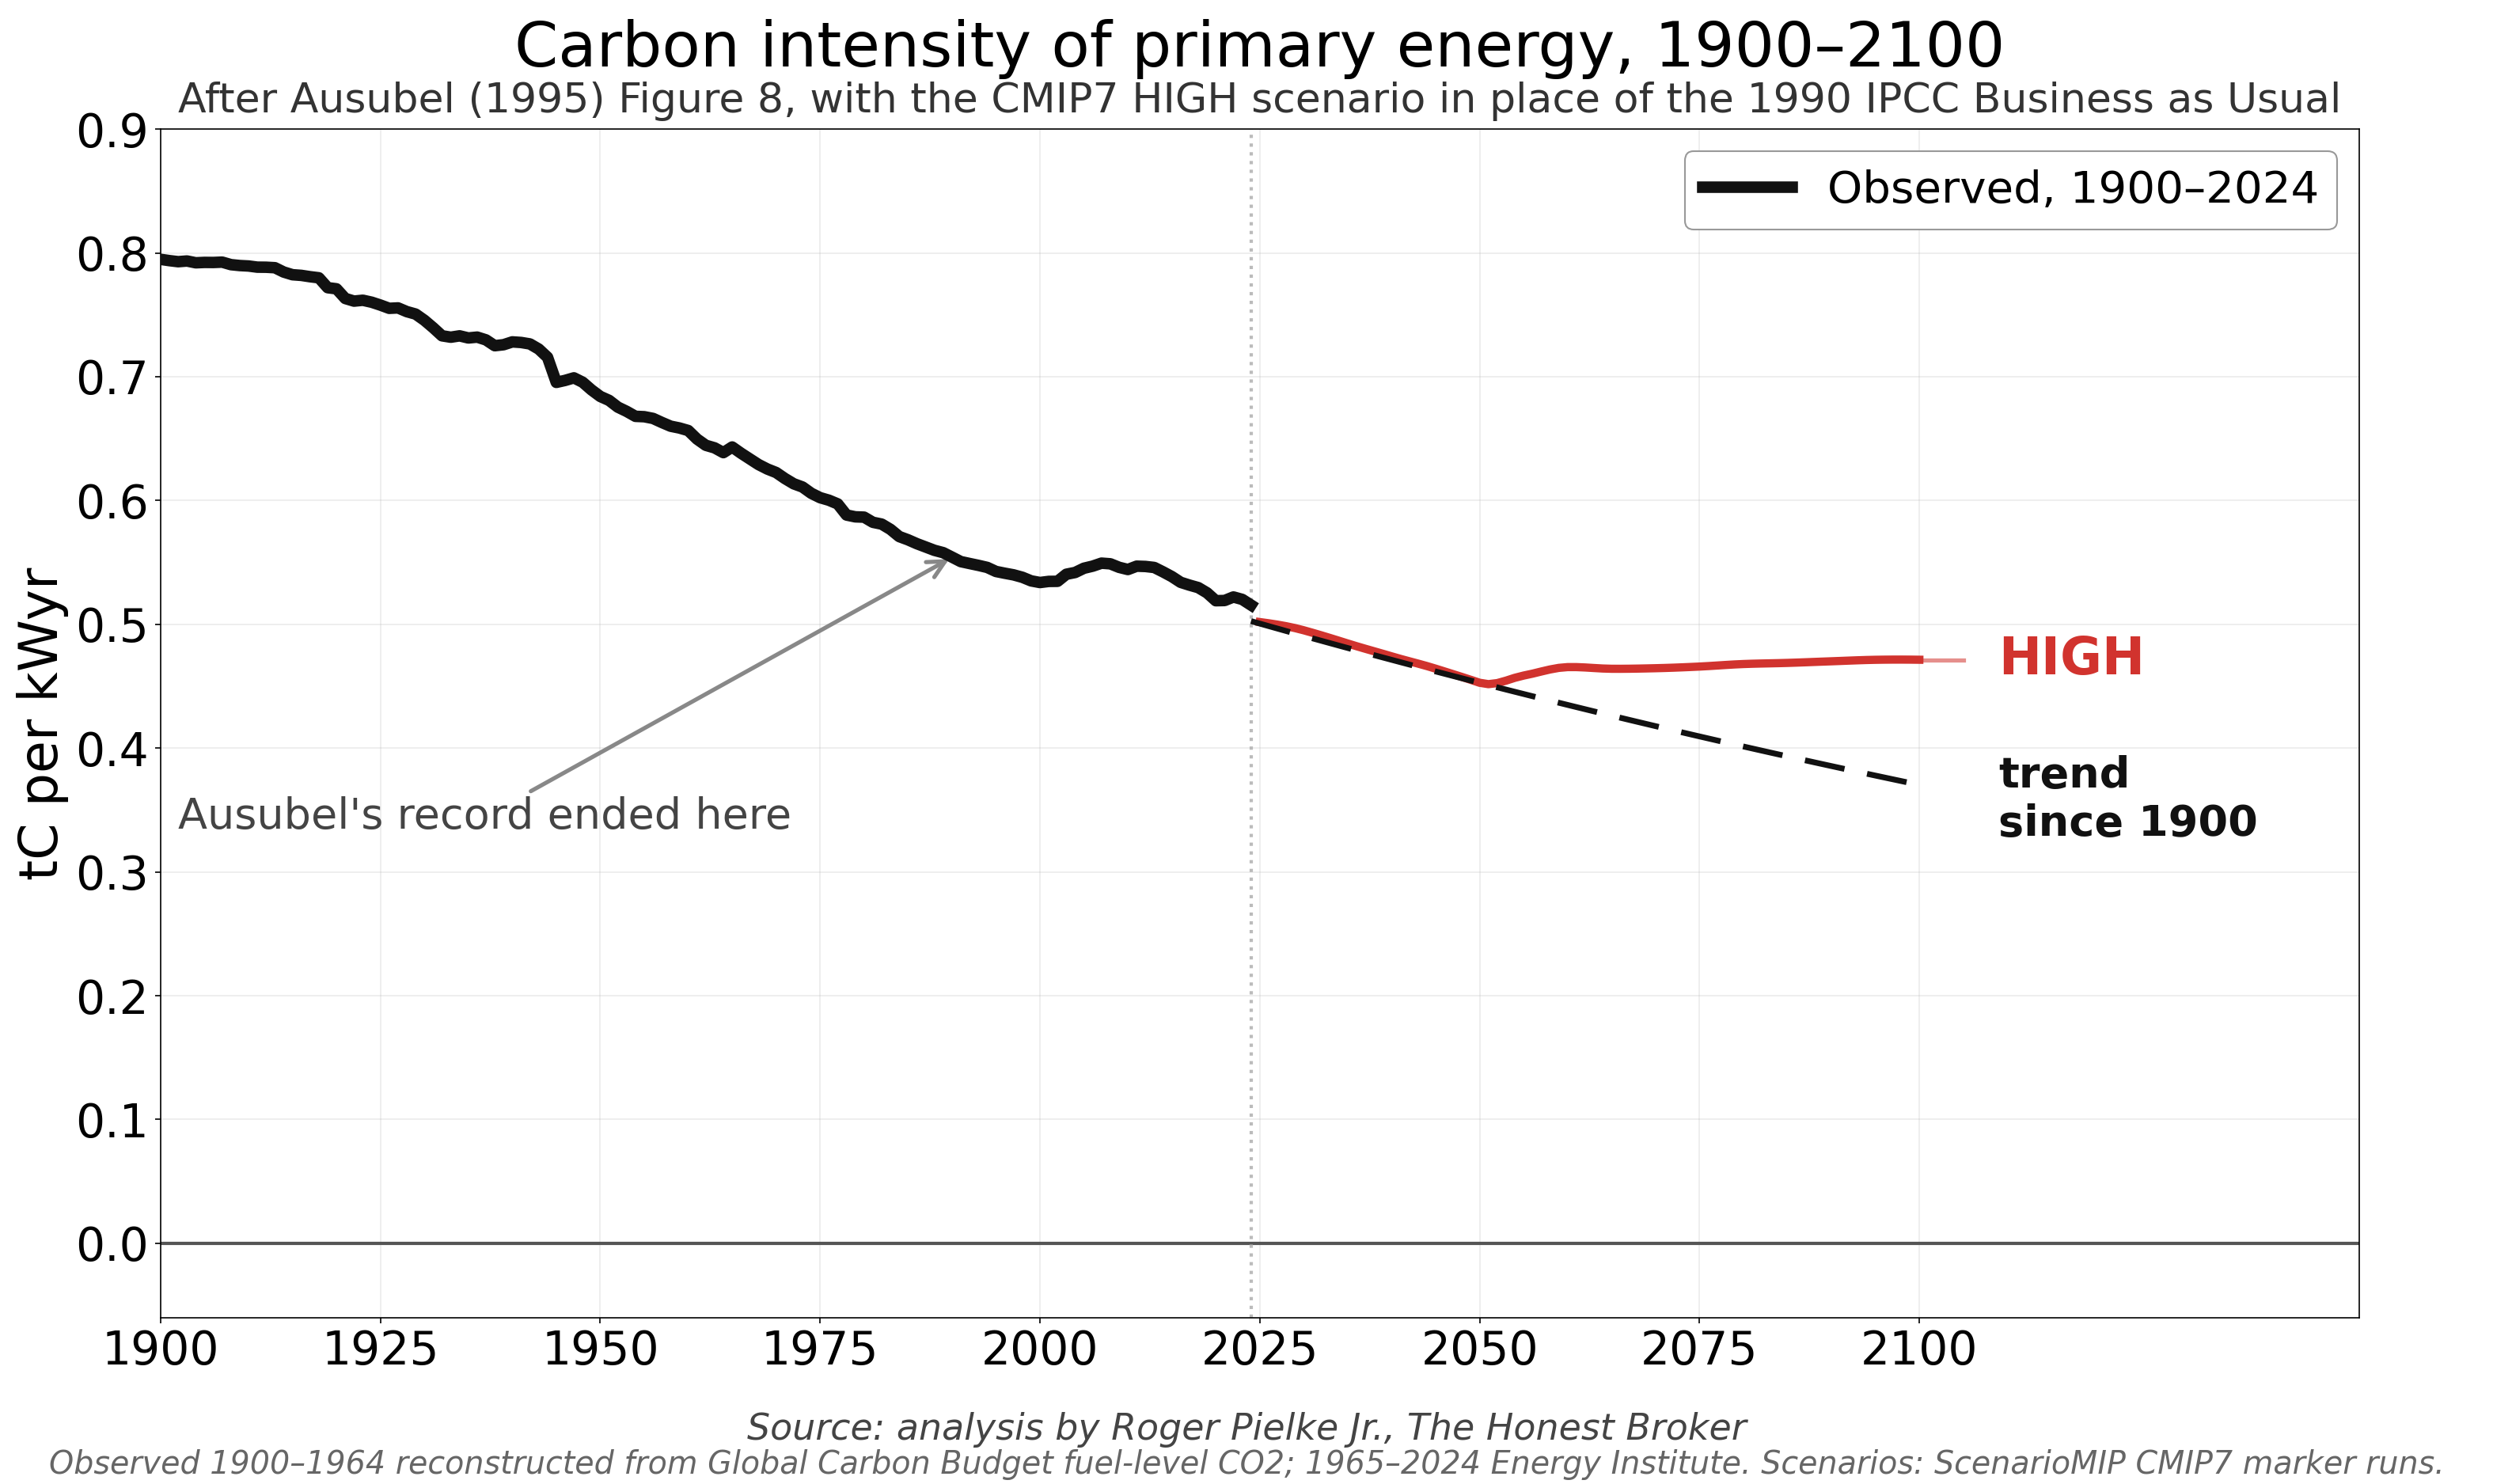
In the units used by Ausubel, tons of carbon per kilowatt-year (tC per kWyr), the carbon intensity of world energy was 0.795 in 1900 and 0.554 in 1990 — where his time series ended — and it reached 0.516 in 2024. Over 1900 to 2024 the trend in carbon intensity decline is 0.40 percent a year, and extending that rate forward results in a carbon intensity of 0.370 by 2100.
In contrast, in 2100, HIGH is 0.471 — it declines at the historical rate to 2050 and then — for some reason — abruptly undergoes “technological regression,” using Ausubel’s phrasing.
Ausubel’s 1995 critique of the 1990 scenario was that it “stifled and even reversed the 130-year trend.” HIGH does the exact same thing after mid-century.
On its face, that assumption seems implausible, but I’d like to hear the justification.
As is now widely understood, the three baseline scenarios that have been retired — SSP5-8.5, SSP3-7.0, and RCP8.5 — were flawed because they assumed, incorrectly, that the world was rapidly moving to a coal dominated future.
HIGH reconsiders and replaces the implausible coal assumption. In HIGH, coal reaches 247 exajoules in 2100, 1.5 times the 2025 level, holding at 27 percent of primary energy — about where it sits now.
Extreme? Yes. Likely? No. Plausible? Yes.
For some applications, these scenarios need only provide emissions or radiative forcing projections (along with a few other variables, like aerosols and land use) for use in earth system modeling. The full socio-economic chassis is unnecessary.
As one climate scientist shared on X/Twitter (here and here):
My weird take on this: We don’t need scenarios at all. Just select a range of concentration pathways. . . As a physical climate scientist/modeler, the reason I like concentration pathways is that CO2 is well-mixed and can be represented very simply by a one global number. One can back calculate emissions corresponding to concentrations.
He is correct — for his type of modeling fully developed scenarios with a socio-economic foundation are not necessary.
However, in climate research and policy scenarios do much, much more.
For instance:
Impact modelers use them to estimate crop losses, heat mortality, and sea level exposure;
Adaptation planners use them to consider infrastructure needs;
Economists project the costs and benefits of both changes in climate and climate policy alternatives;
Regulators and litigators cite them.
A scenario includes assumptions about population, income, technology, institutions and more — each of which is an important consideration in thinking about policies. So the socio-economic foundations of a scenario matters as much as its emissions total.
After all, projections of future climate are not a parlor game — they are intended to inform decision making today.
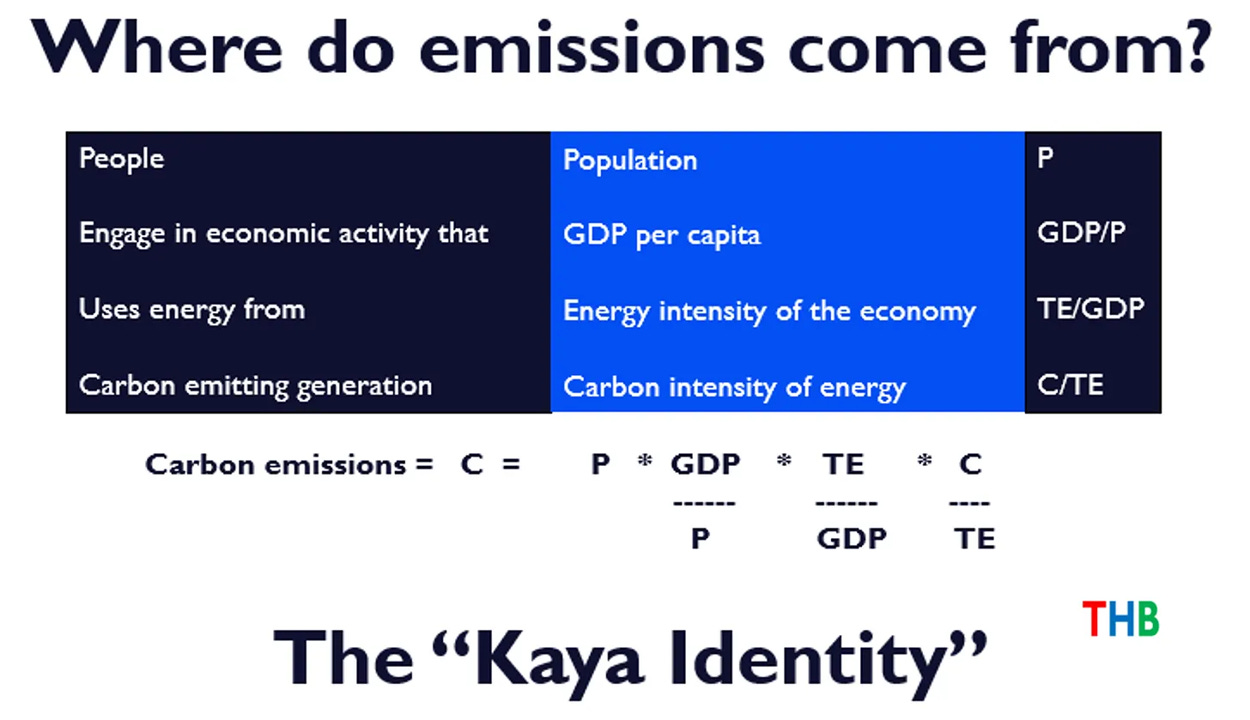
The analysis that follows uses the Kaya Identity, which is summarized in the figure below and a central focus of my book The Climate Fix (full text available to THB paid subscribers here). Ausubel’s figure above that shows the trend in carbon intensity of energy is the third factor in the Kaya Identity.
The table below shows for all 7 of the new CMIP7 scenarios a full decomposition of Kaya factors along with the implied annual rate of change in carbon dioxide emissions in the final column.
The top two rows show what has happened in the real world since 1990 and 2015. Since 1990 world population increased at 1.26% per year and per capita GDP increased at 1.91% per year. Energy intensity fell at 1.43% per year and the carbon intensity of energy fell at only 0.21% per year.
That means that to date, the decarbonization of the global economy was mainly driven by declines in the energy intensity of the economy. The fuel mix did become more carbon efficient, but that contributed just a fraction of the overall rate of decarbonization.
You can see from the table that to accelerate decarbonization consistent with the various LOW scenarios, carbon intensity declines are going to have to increase dramatically, in some cases infeasibly.
The table below shows the projected global energy system for 2100 under HIGH. Fossil energy barely declines as a percentage of the global mix, nuclear plummets, solar and wind quadruple. The result is a carbon intensity of energy just a bit lower than today.
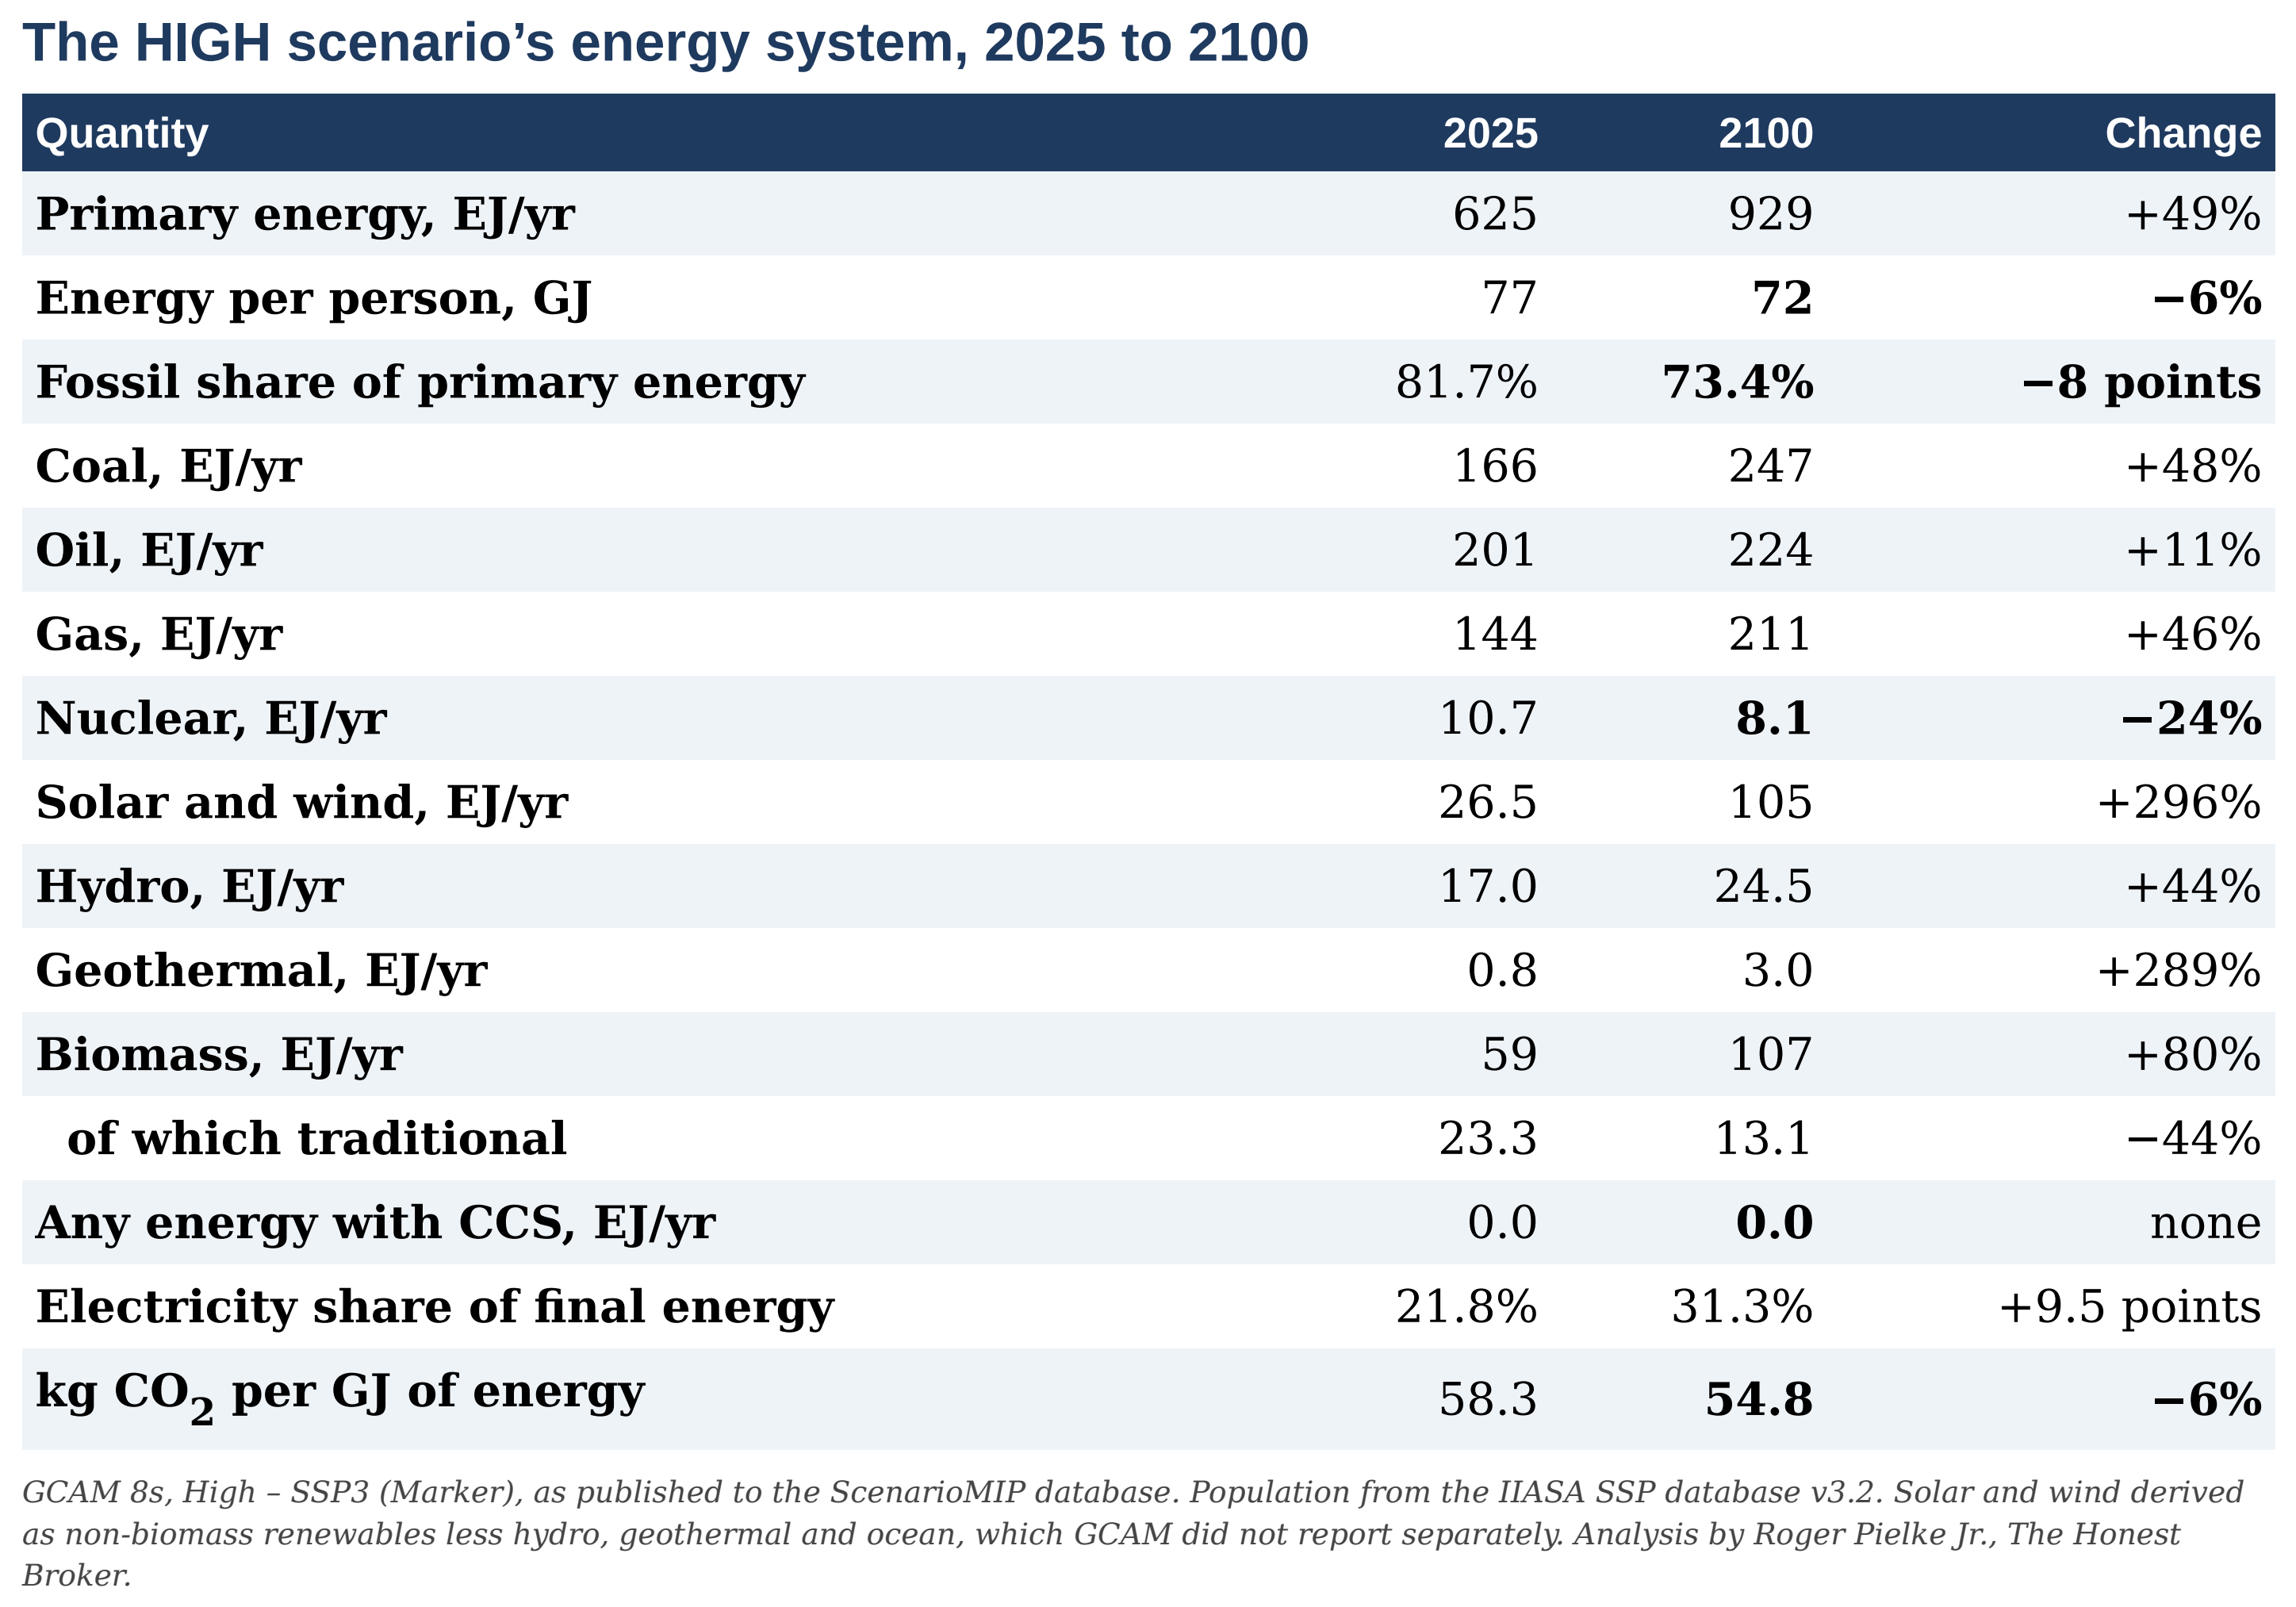
Under HIGH, world primary energy grows by about 50%, from 625 exajoules in 2025 to 929 in 2100, while population grows by five billion. That means that energy consumption per person therefore falls, from 77 GJ to 72 GJ — below today’s 73 GJ. The average person consumes no more energy than now.
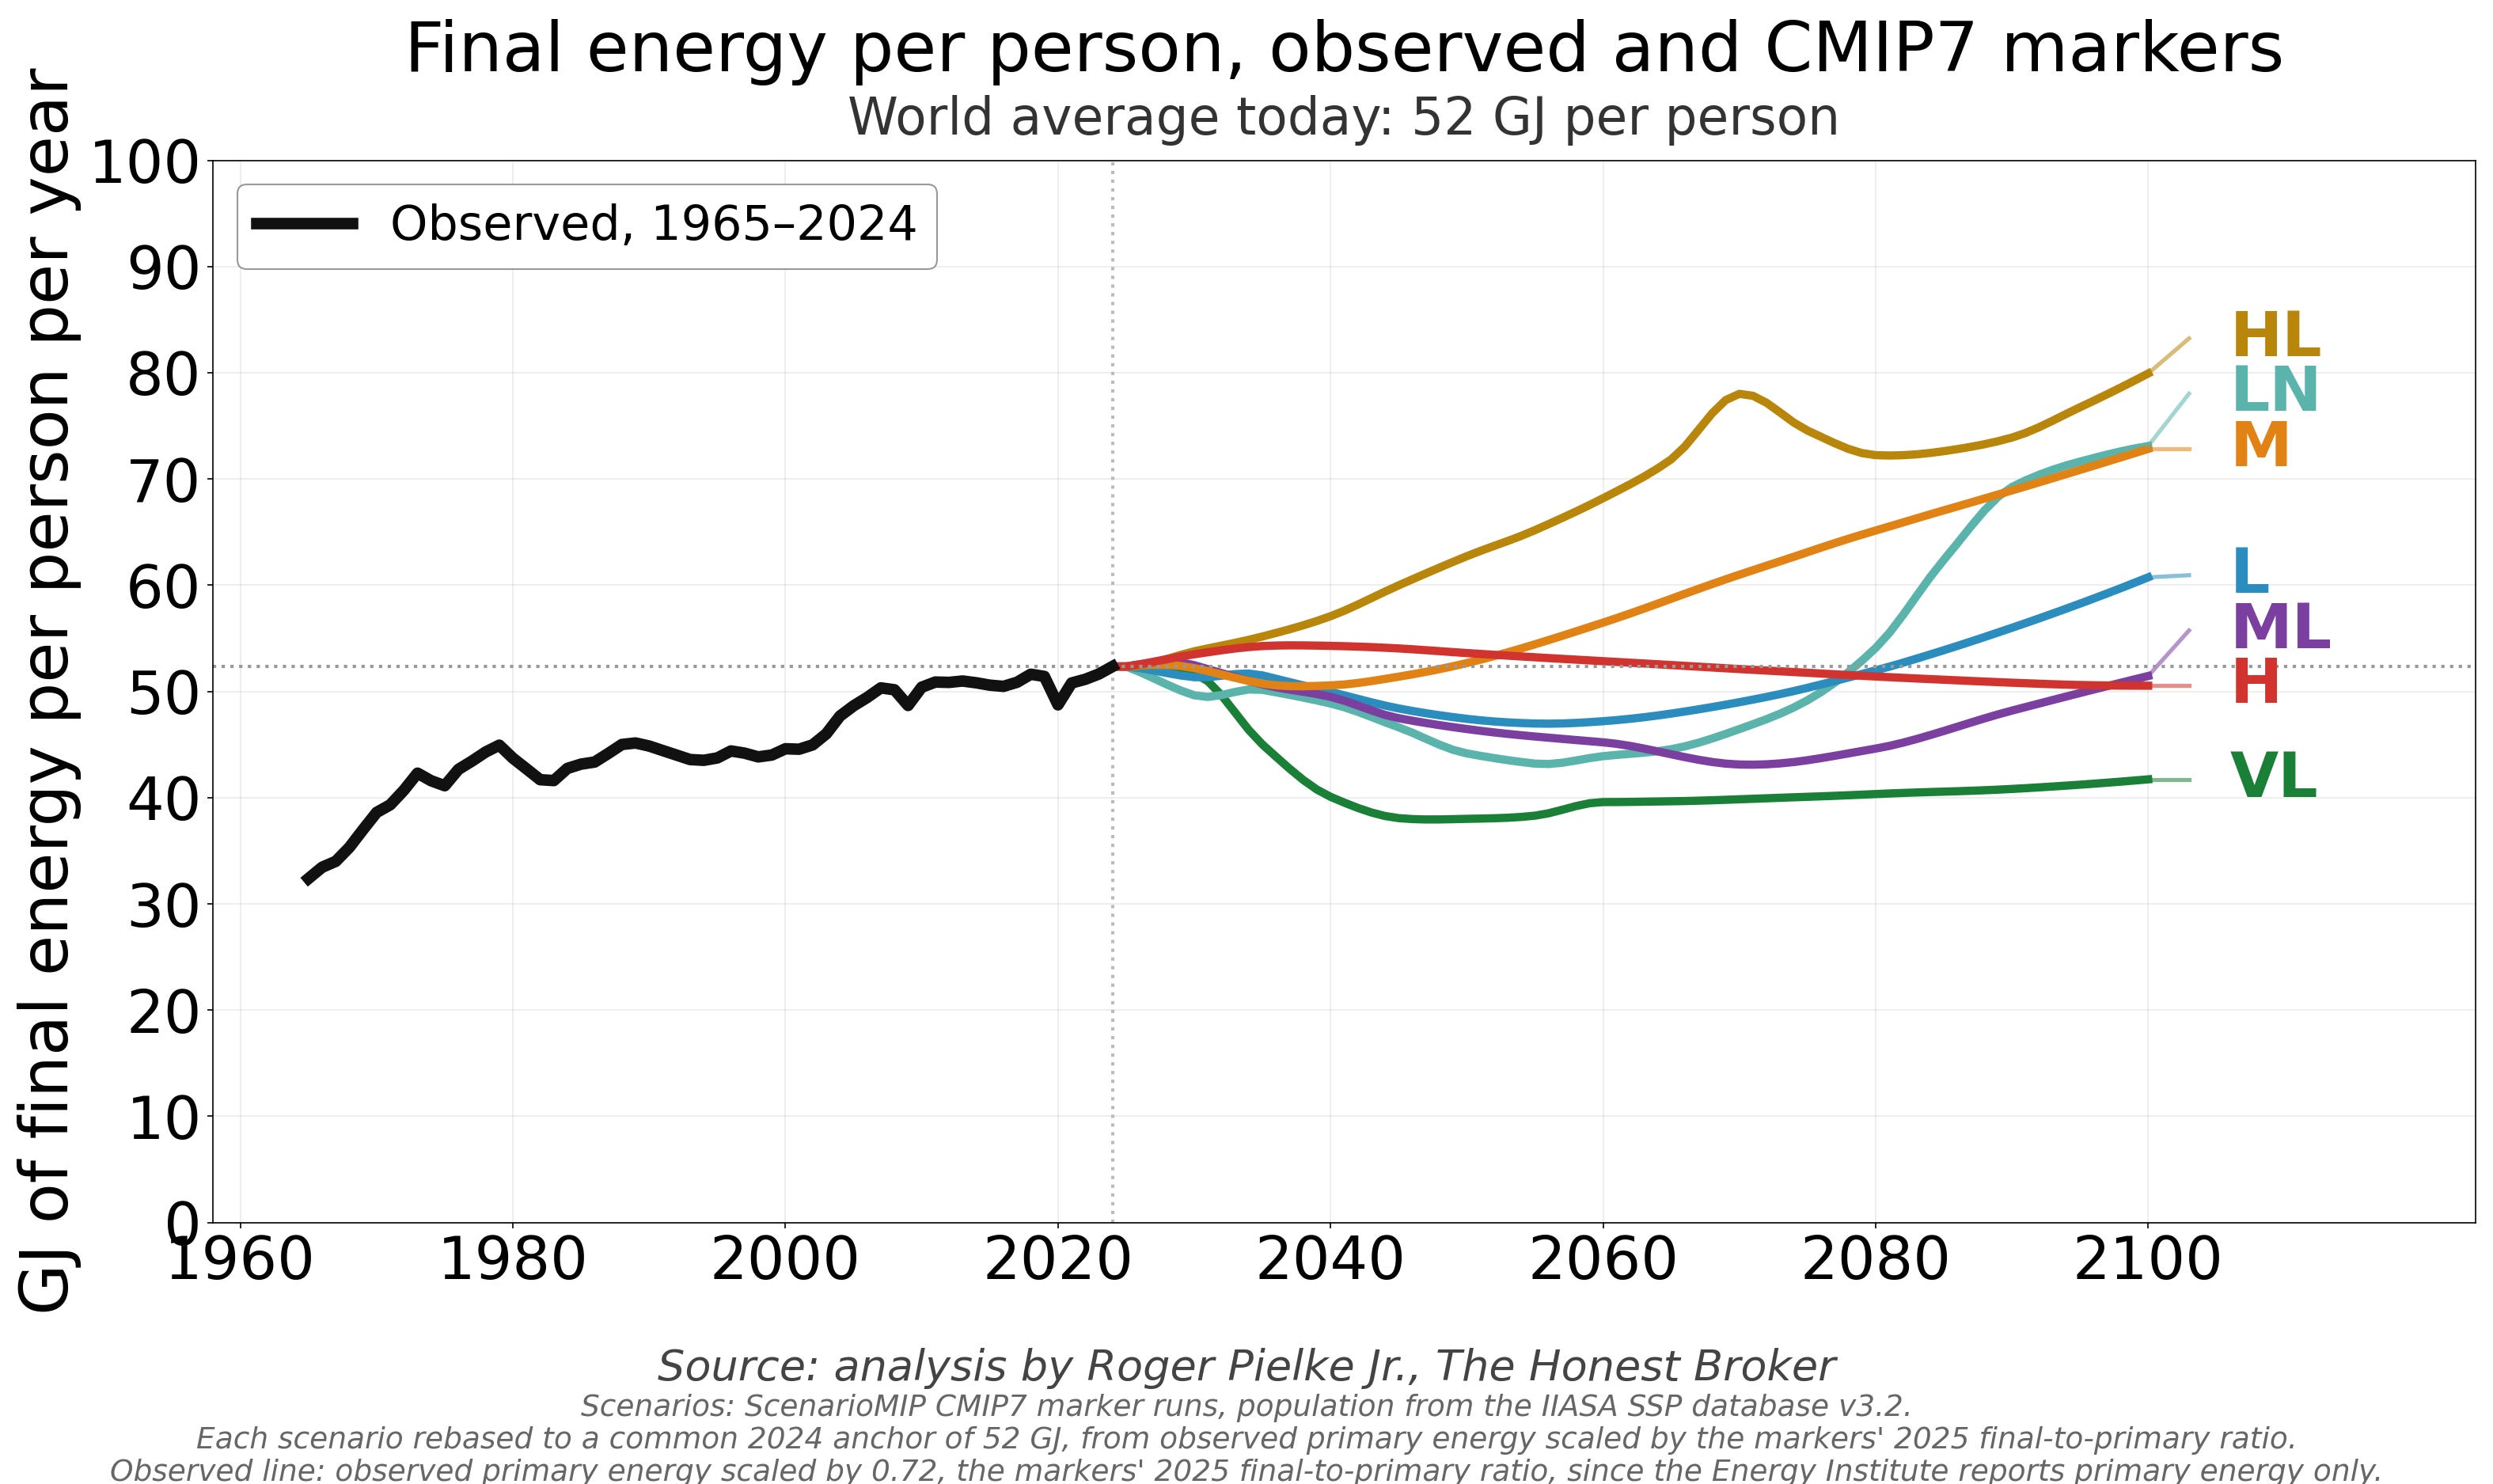
The trajectory of final energy consumption (how much useful energy people actually use) also declines, as shown in the figure below. Interestingly, four of the seven scenarios assume decreasing energy consumption per person to at least 2075.
Does that seem plausible?
These data show that HIGH emissions do not come from a world consuming vast quantities of energy or large quantities of energy per person. They come from a world that adds 300 exajoules of energy and meets almost three quarters of it with fossil fuels — coal alone growing 48 percent — so the carbon intensity of energy barely shifts, from 58.3 kg per gigajoule in 2025 to 54.8 in 2100.
The means that the carbon intensity of energy is at 58.3 kg of CO₂ per gigajoule in 2025 and 54.8 in 2100.
Pessimistic? Yes. Contrary to history? Yes. Plausible? Perhaps.
The carbon intensity of energy has never fallen fast. But the assumption that energy intensity slows by half is a much harder case to make, and CMIP7 does not make it.
If we collapse the last two Kaya terms into carbon intensity of GDP, we can identify the country whose energy economy today best matches the world envisioned in each CMIP7 for the world in 2100.
The world of 2024, at 0.204 kg CO₂ per dollar resembles India of 2024 (0.216).
In 2100, SSP5-8.5 is 0.064 and the world resembles France of 2024 (0.067).
In 2100, SSP3-7.0 is 0.144 and the world resembles Turkey of 2024 (0.140).
In 2100, HIGH is 0.115 and the world resembles Egypt of 2024 (0.115).
In 2100, MEDIUM is 0.040 and the world resembles Switzerland of 2024 (0.043).
Does a world in 2100 with an energy economy that looks like Egypt’s in 2024 seem plausible?
The figure below shows rates of decarbonization (i.e., reduction of carbon dioxide per unit of GDP) for each of the seven CMIP7 scenarios along with SSP5-8.5 and a simple extrapolation of the 1990 to 2024 rate.
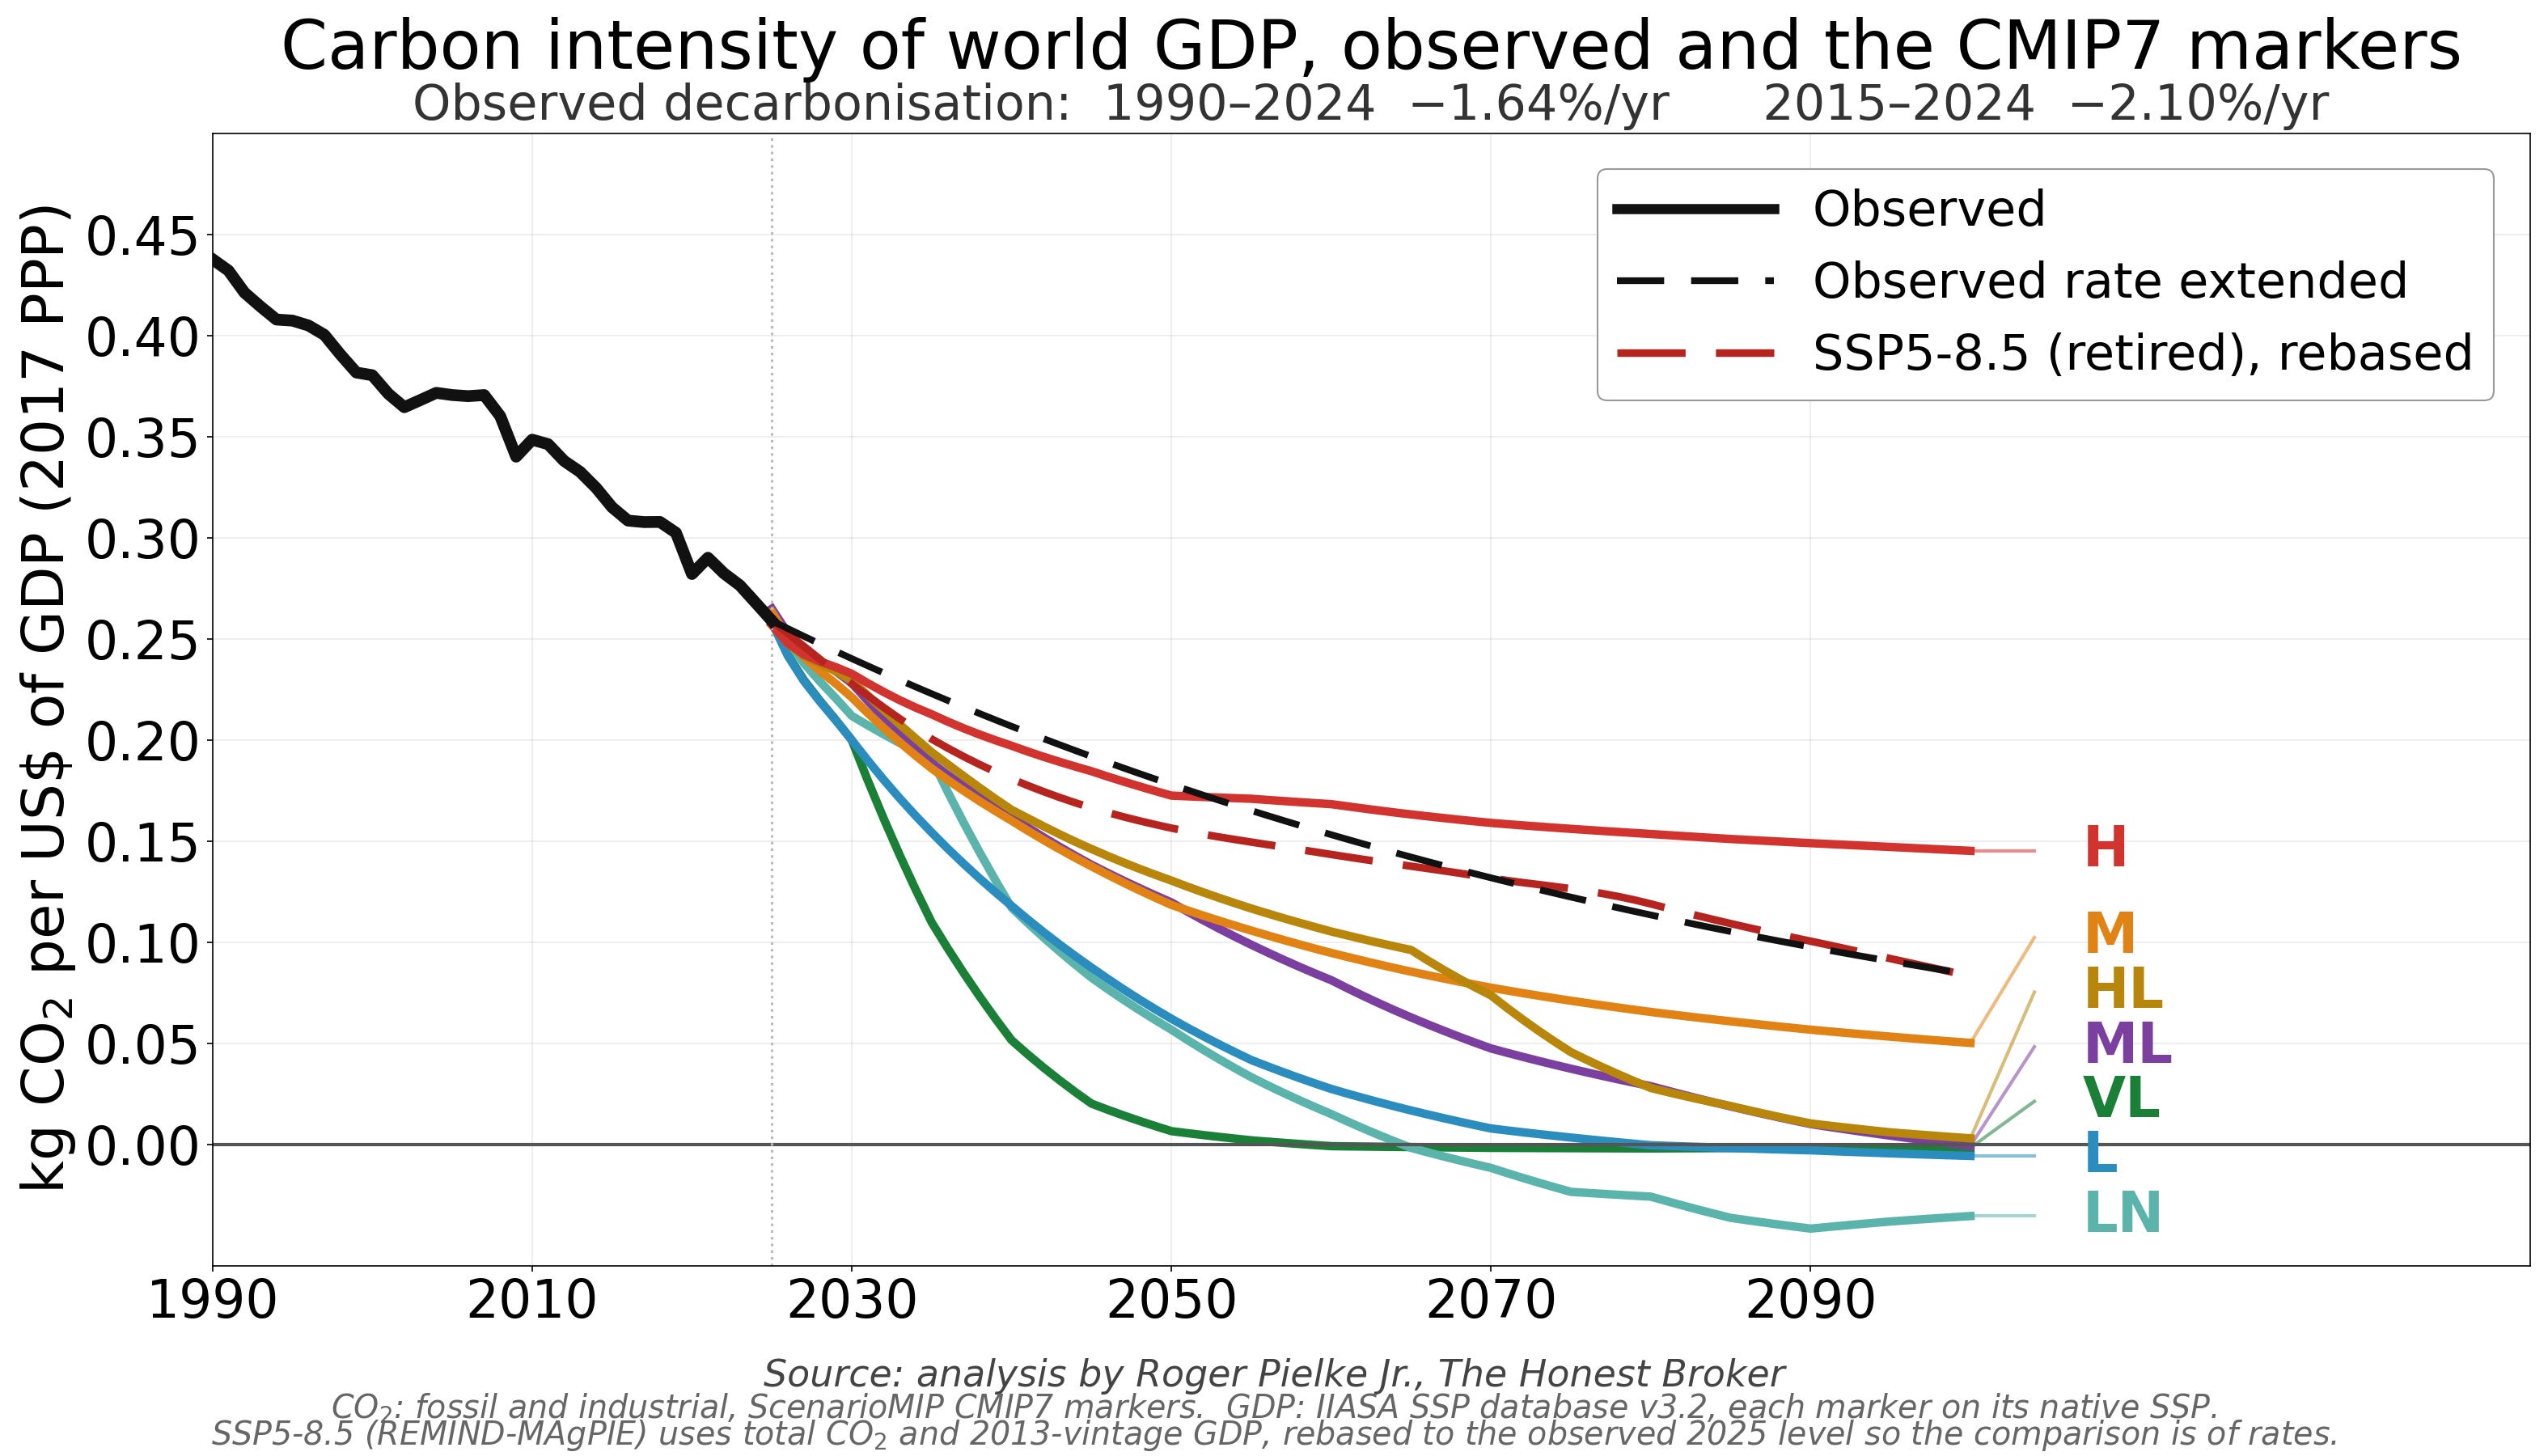
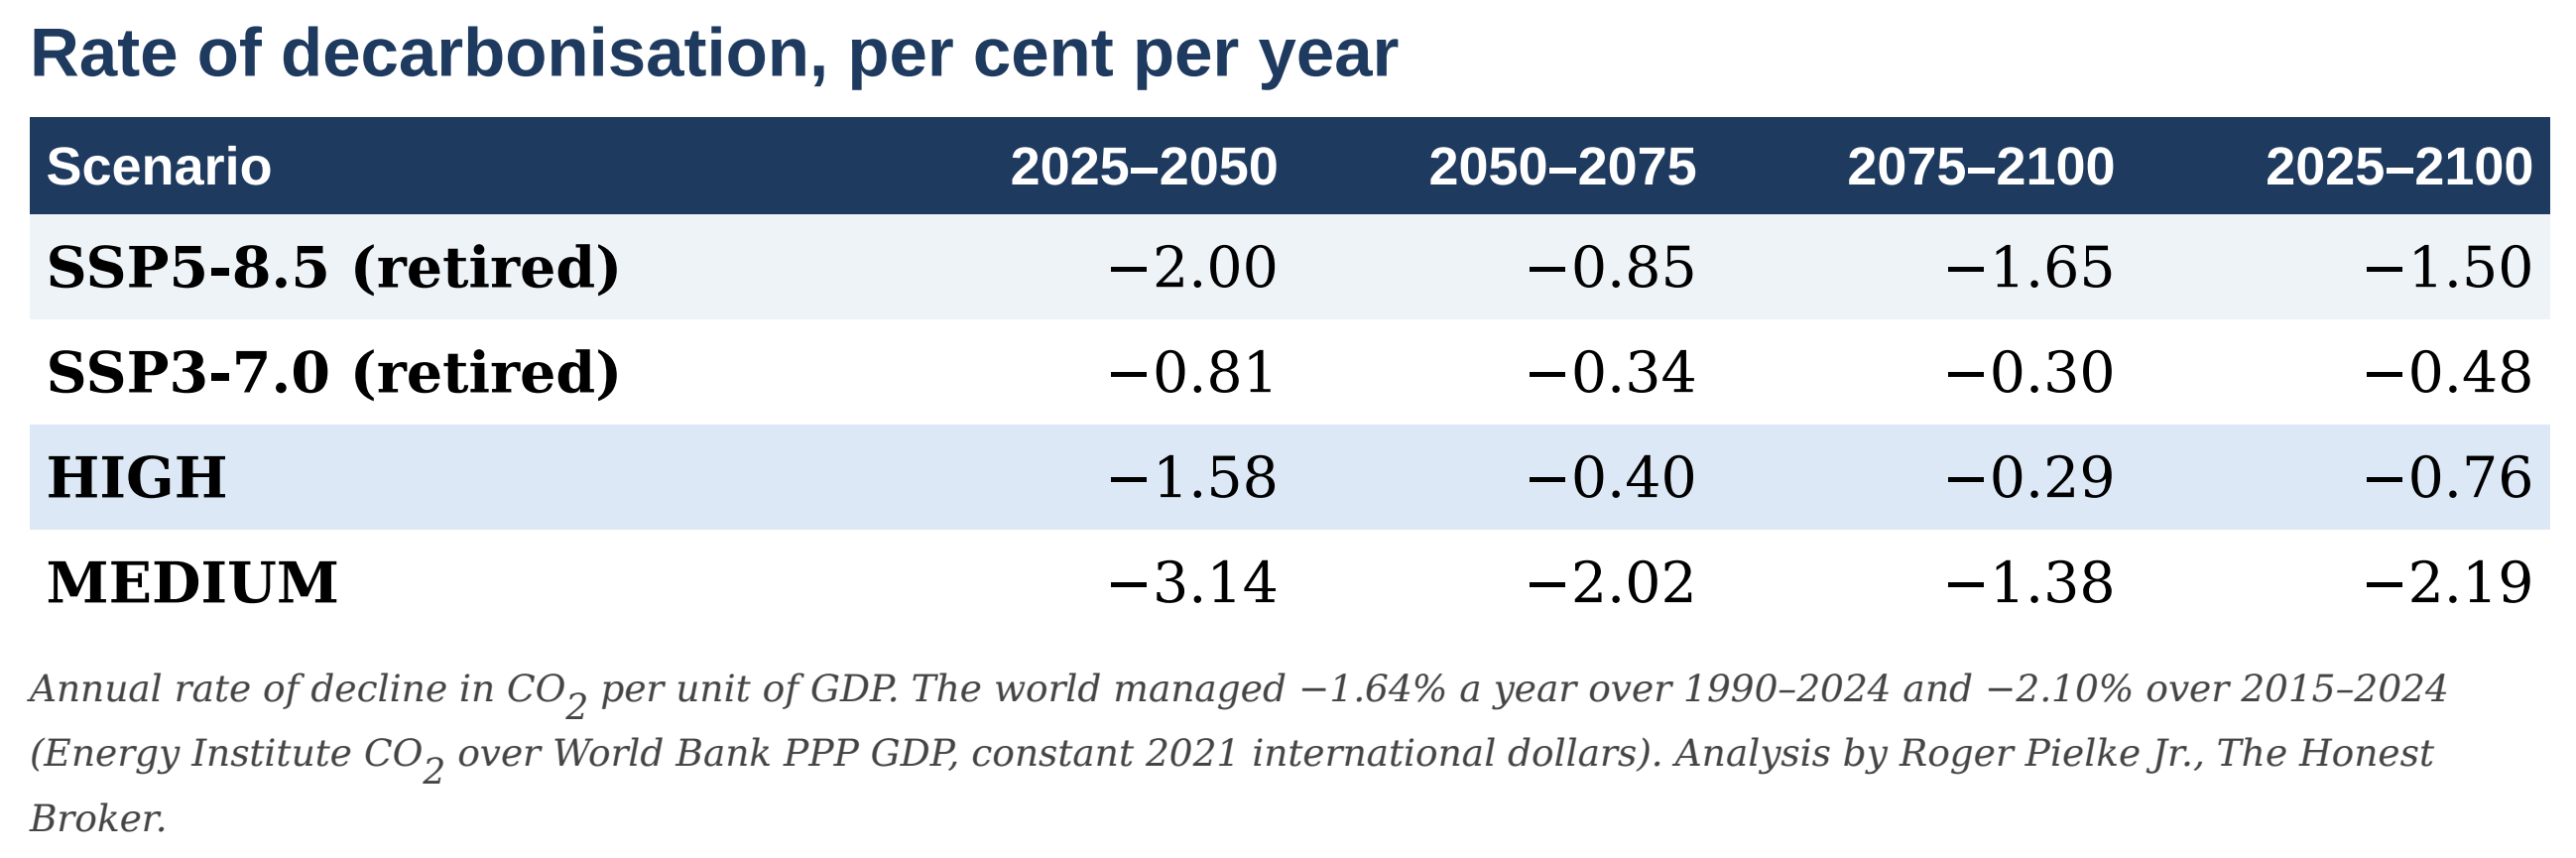
The table below shows rates of decarbonization for two retired scenarios and the new HIGH and MEDIUM. It shows that MEDIUM assumes a rate of decarbonization similar to that of 2015 to 2024, extended to 2100, and HIGH is much more pessimistic, assuming a dramatic slowdown in the rate of decarbonization through the rest of the century.
In terms of cumulative carbon dioxide emissions to 2100, HIGH exceeds MEDIUM by 977 GtCO₂ of energy CO₂. Based on the Kaya Identity, here is what explains the difference:
population +302 GtCO₂
GDP per person −1,226
energy per unit of GDP +1,022
CO₂ per unit of energy +879.
HIGH describes a technologically stagnant global economy in a crowded, poor world. Emissions per person fall from 4.8 tonnes today to 3.7 in 2100, below the level the world last recorded in 1968.
Interestingly, CMIP7 admits that they could have based HIGH on SSP5 instead of SSP3. The SSP5 storyline envisions a wealthy, technologically advanced world in 2100.
In their words, the emissions of scenarios build on SSP3 and SSP5,
“could be reasonably similar, with SSP5 often being slightly above SSP3 scenarios.”
They explain why they chose SSP3:
“The high challenges to adaptation in SSP3 would make these variants more interesting from an impact perspective.”
The table below shows that SSP3 is a crowded, poor world and SSP5 has almost 5 billion fewer people who have an average income more than 6x greater than today.
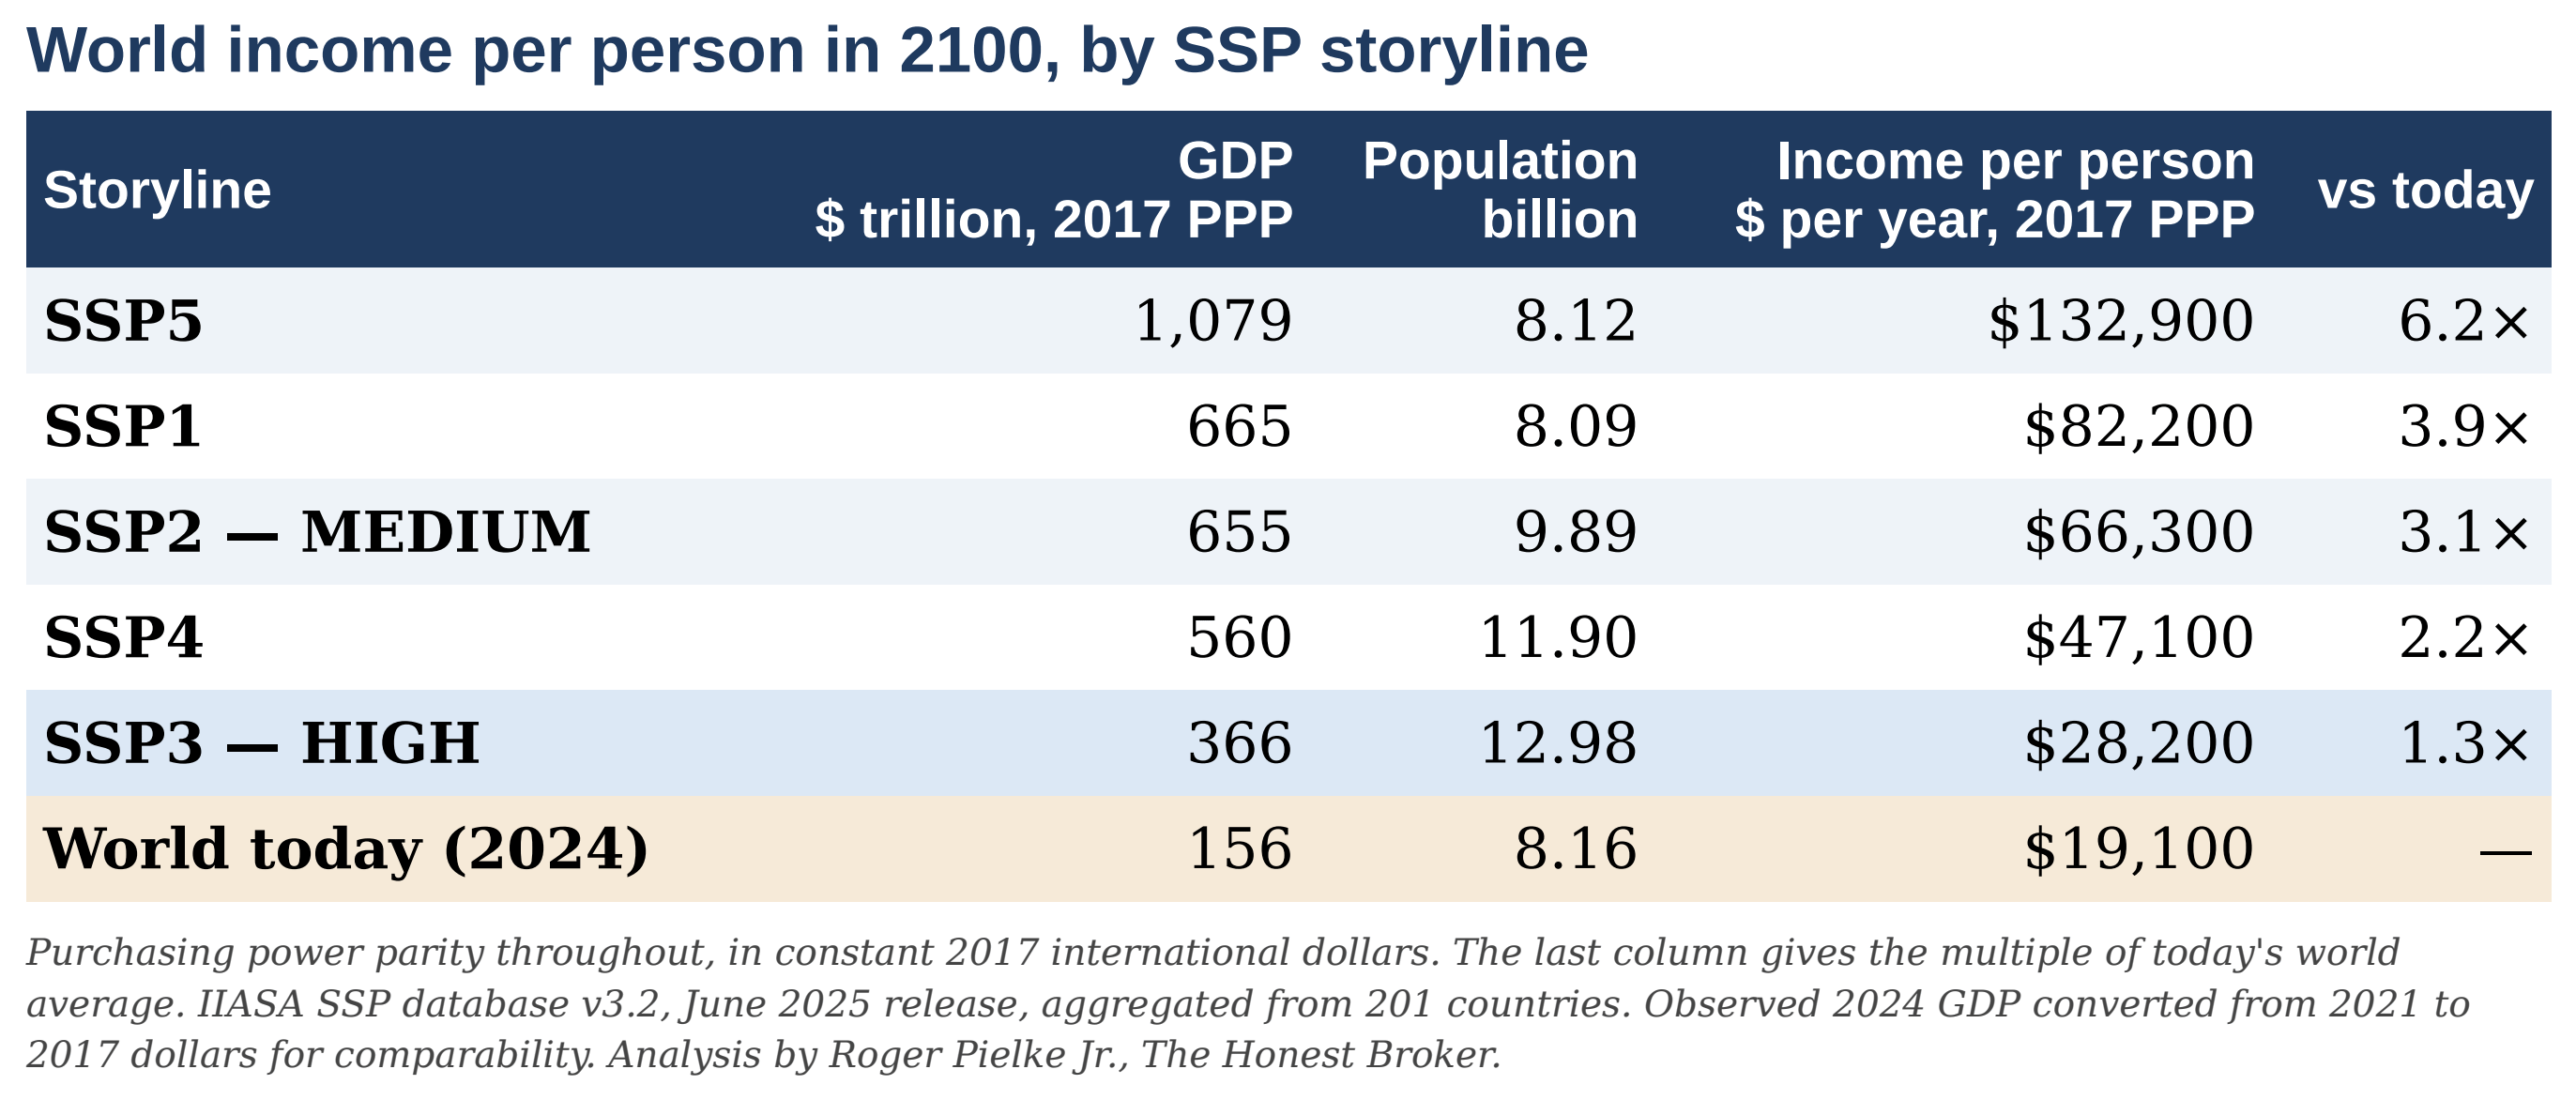
Given two ways to build a high-emissions scenario — one, a poor world more vulnerable to changes in climate, and another, a wealthy world much more resilient to changes in climate — they picked the one harder to adapt to.
They made this judgment based not on plausibility, but the fact that the poor world seemed more “interesting.” That is a valid decision for exploratory modeling, but not for policy planning.
Consider the implications of that choice: Every impact study, adaptation assessment, and cost-benefit calculation built on HIGH will be based on a world of 13 billion people at an average per capita GDP of $28,000 — with weak institutions, fractured trade and minimal adaptive capacity, bundled with the highest emissions in the set.
The projected social and economic impacts of changes in climate based on such a combination will of course be large and negative — much larger than a scenario with the same cumulative emissions but based on SSP5.
It is a catastrophist’s dream scenario.
Under the previous generation of scenarios, researchers who wanted the worst of both worlds had to build a chimera: SSP3-8.5, jury rigging the highest forcing level onto the socioeconomic storyline with the greatest vulnerability. The SSP3 storyline could not reach 8.5 W/m² on its own, so that combination was never plausible to begin with — though many researchers assembled it anyway, and it appeared throughout the literature.
With HIGH, CMIP7 has produced the same combination as an official marker — no chimera required.
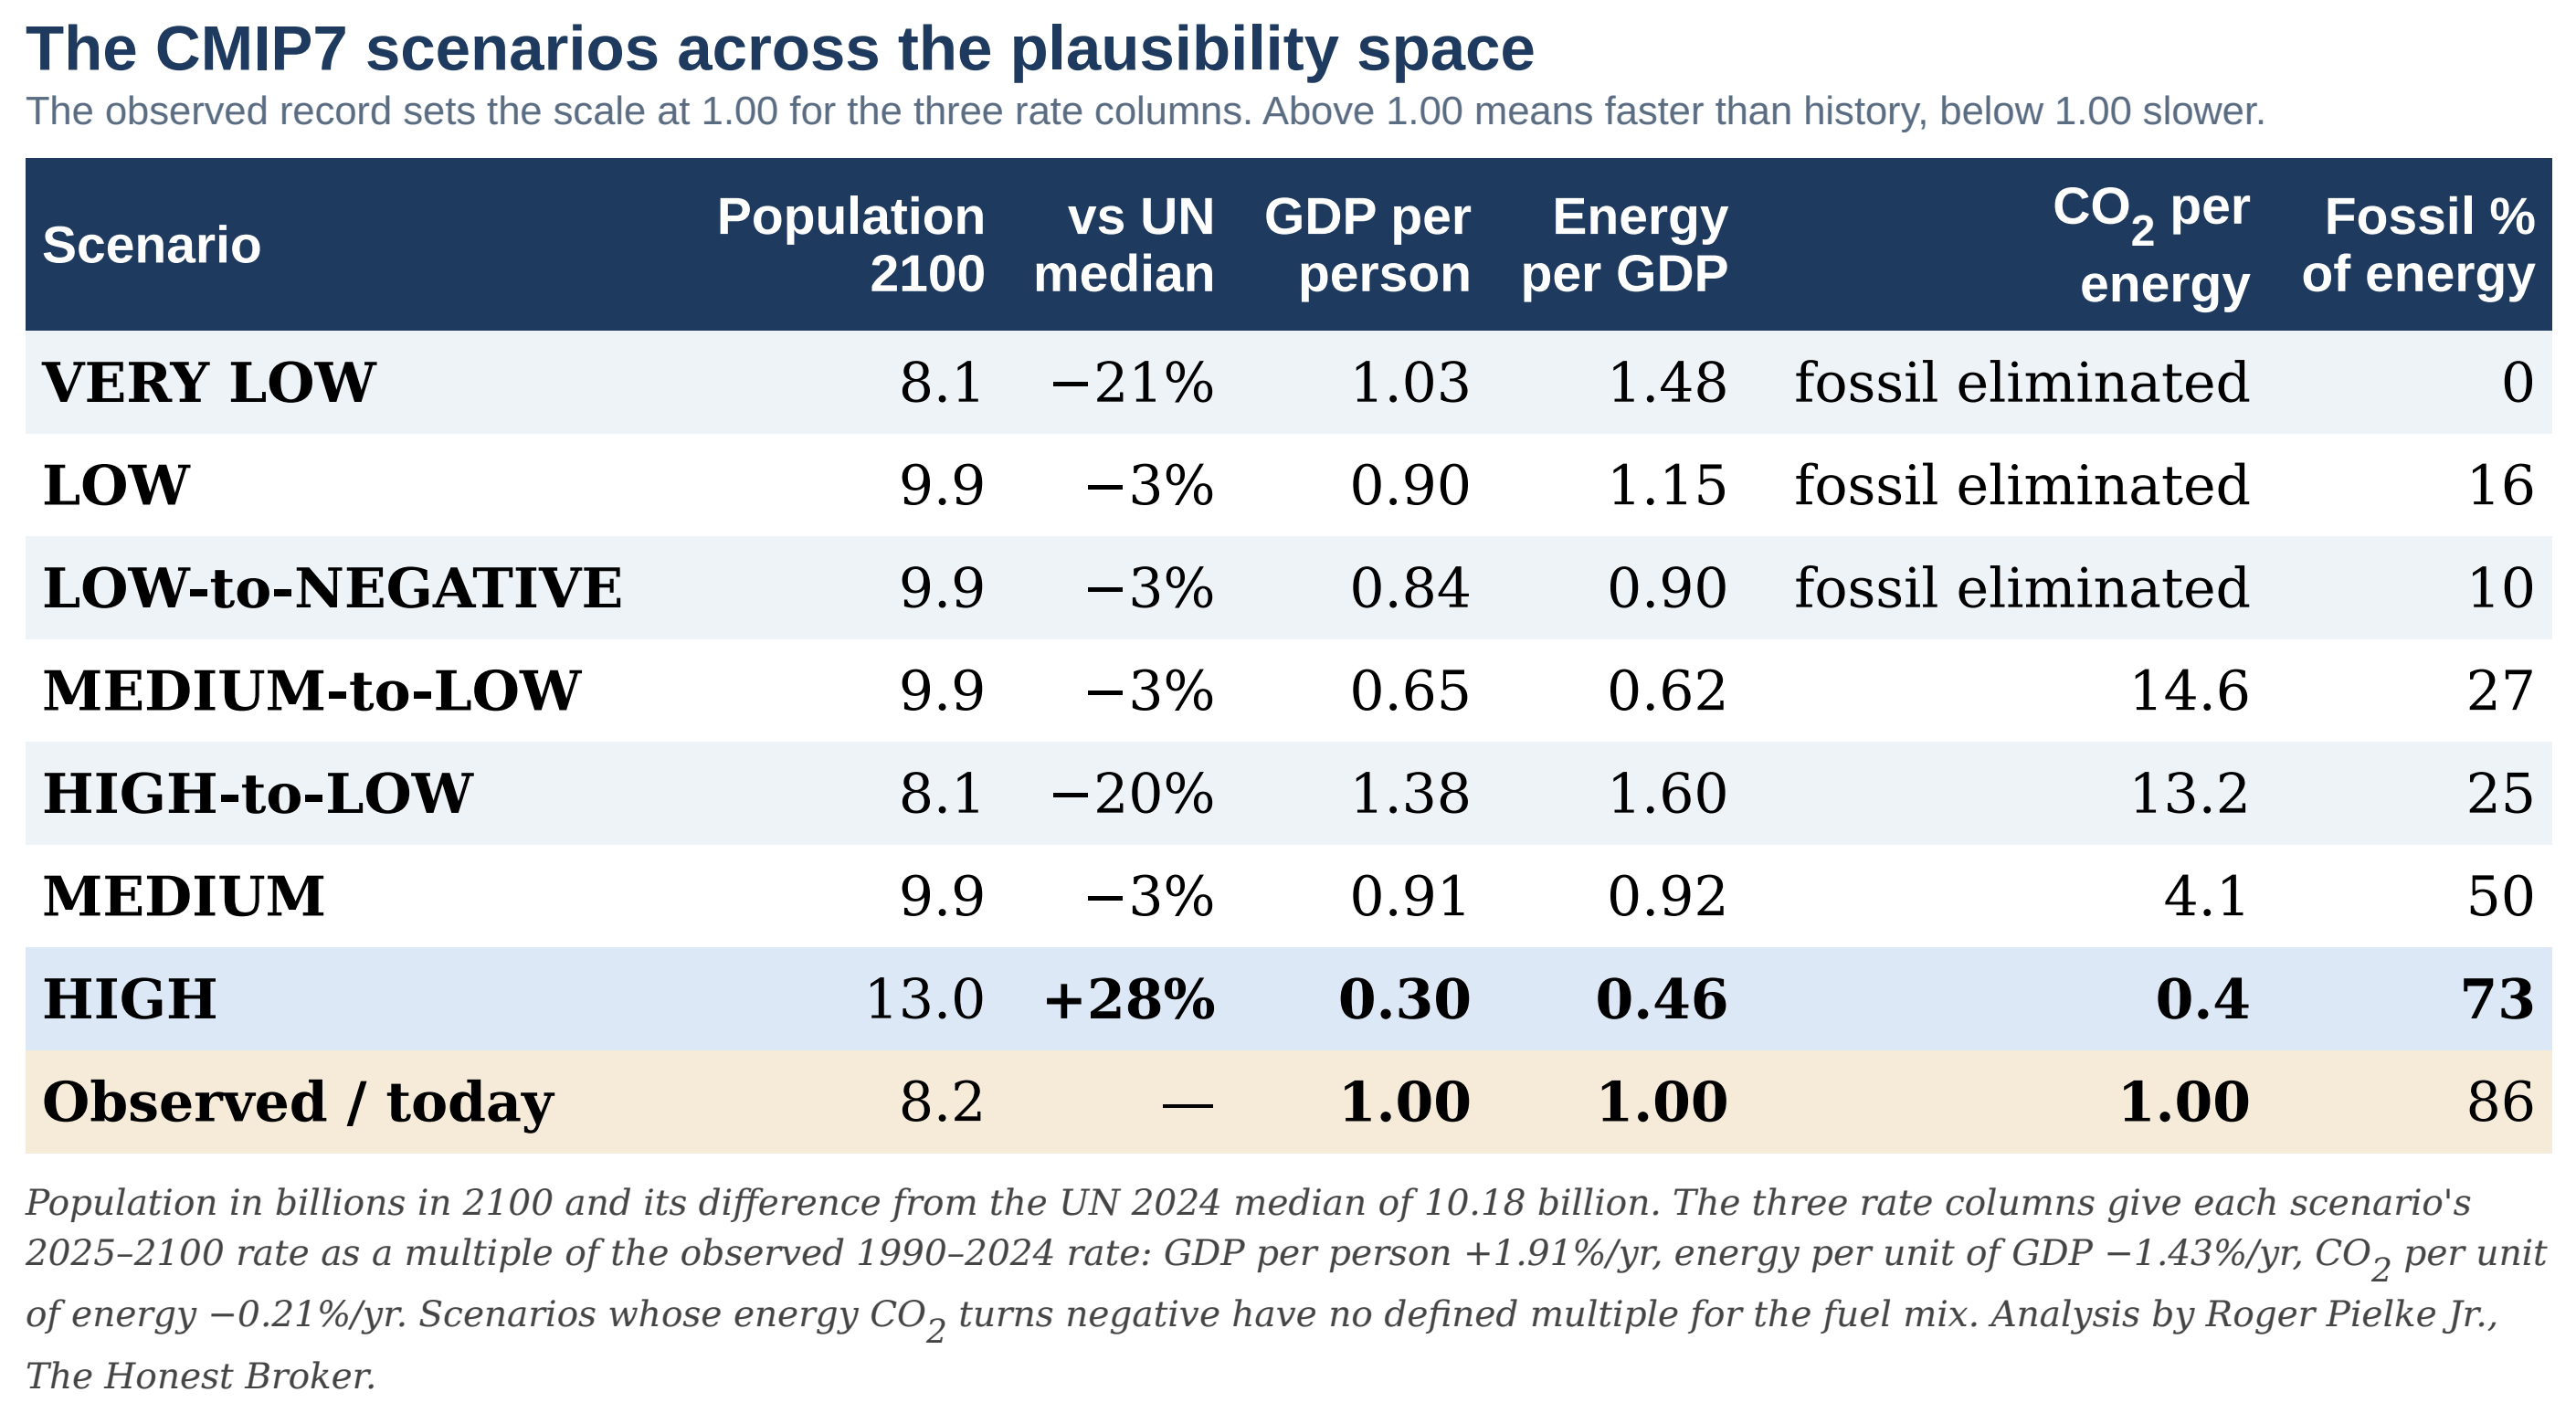
The table above brings things together and shows all seven CMIP7 scenarios versus observations. Each rate of change for per capita GDP, energy intensity, and carbon intensity appears as a multiple of the observed 1990–2024 rate. Above 1 means faster than history, below 1 means slower.
Every scenario departs from history somewhere — which is a good thing as these are scenarios, not simple extrapolations.
MEDIUM comes closest to history — population near the UN median, income at 0.91 of the observed rate, efficiency at 0.92 — departing significantly only in a carbon intensity change at 4.1 times faster than history.
LOW, LOW-to-NEGATIVE and VERY LOW require achievements with no precedent: eliminating fossil fuel carbon dioxide completely from energy supply.
HIGH-to-LOW has the greatest departure from history across the board — population 20 percent below the UN median, income 1.38 times faster than history, efficiency 1.60 times faster, fuel mix decarbonizing 13.2 times faster. Seemingly infeasible.
Only HIGH puts all three technology and economy terms below the historical rate — it is uniformly pessimistic. Every other marker assumes the world will see economic or technological improvements in at least one variable that is more optimistic than observed.
Mitigation scenarios (the flavors of LOW) answer a policy question — what would it take to achieve the specified outcomes? These scenarios should thus be evaluated on their feasibility.
Importantly, CMIP7 is clear that HIGH is not a baseline or a reference scenario and should not be used as such in conjunction with the other CMIP7 scenarios:
The [HIGH] scenario is based on trends that may not be the most likely (based on a current assessment), but that are still plausible. . .These trends can be characterized as policy roll-back, lack of cooperation in addressing global environmental concerns, increased interest in fossil fuel resources, adoption of resource- and energy-intensive technologies and lifestyles and lack of development in low-emission technology. Clearly, this scenario is not a “business-as-usual” scenario nor the no-policy reference scenario for the other scenarios. The scenario is intended to explore the upper end of GHG emissions resulting from deep political, technological, and structural deviation from current trends.
As described, this offers a compelling justification for HIGH as an exploratory scenario. Its extreme global population assumption and SSP3 foundation limit its possible relevance.
Despite this, CMIP7 goes too far when they opine without evidence or argument on the likelihood of its version of HIGH:
There are various reasons why such a scenario could emerge. For instance, a rollback of climate policies could result from a lack of public support for the energy transition. This could be related to, for instance, local opposition to building new wind farms or concerns about impacts on fossil industries related to jobs and national energy security. Also, the rapid cost decrease in renewable energy of the past decade could be discontinued, possibly as a result of regional scarcity and limited tradability in materials for solar and wind technologies and EV batteries.
None of this comes remotely close to justifying the extreme pessimistic quantitative features of HIGH.
Let’s next construct a simple extreme scenario: I create the highest emissions path that uses only assumptions based on the UN population projections or history.
Population at the top of the UN’s 2024 95 percent interval, 11.4 billion by 2100.
Income per person increasing at 2.23 percent a year, the fastest sustained 25-year rate on record.
Energy intensity improvements at 1.36 percent, the slowest 25-year rate since 1990.
Carbon intensity of energy reductions at 0.17 percent, the slowest 30-year rate since 1965.
This combination of assumptions results in cumulative carbon dioxide emissions for the rest of the century above HIGH, as you can see in the table below.
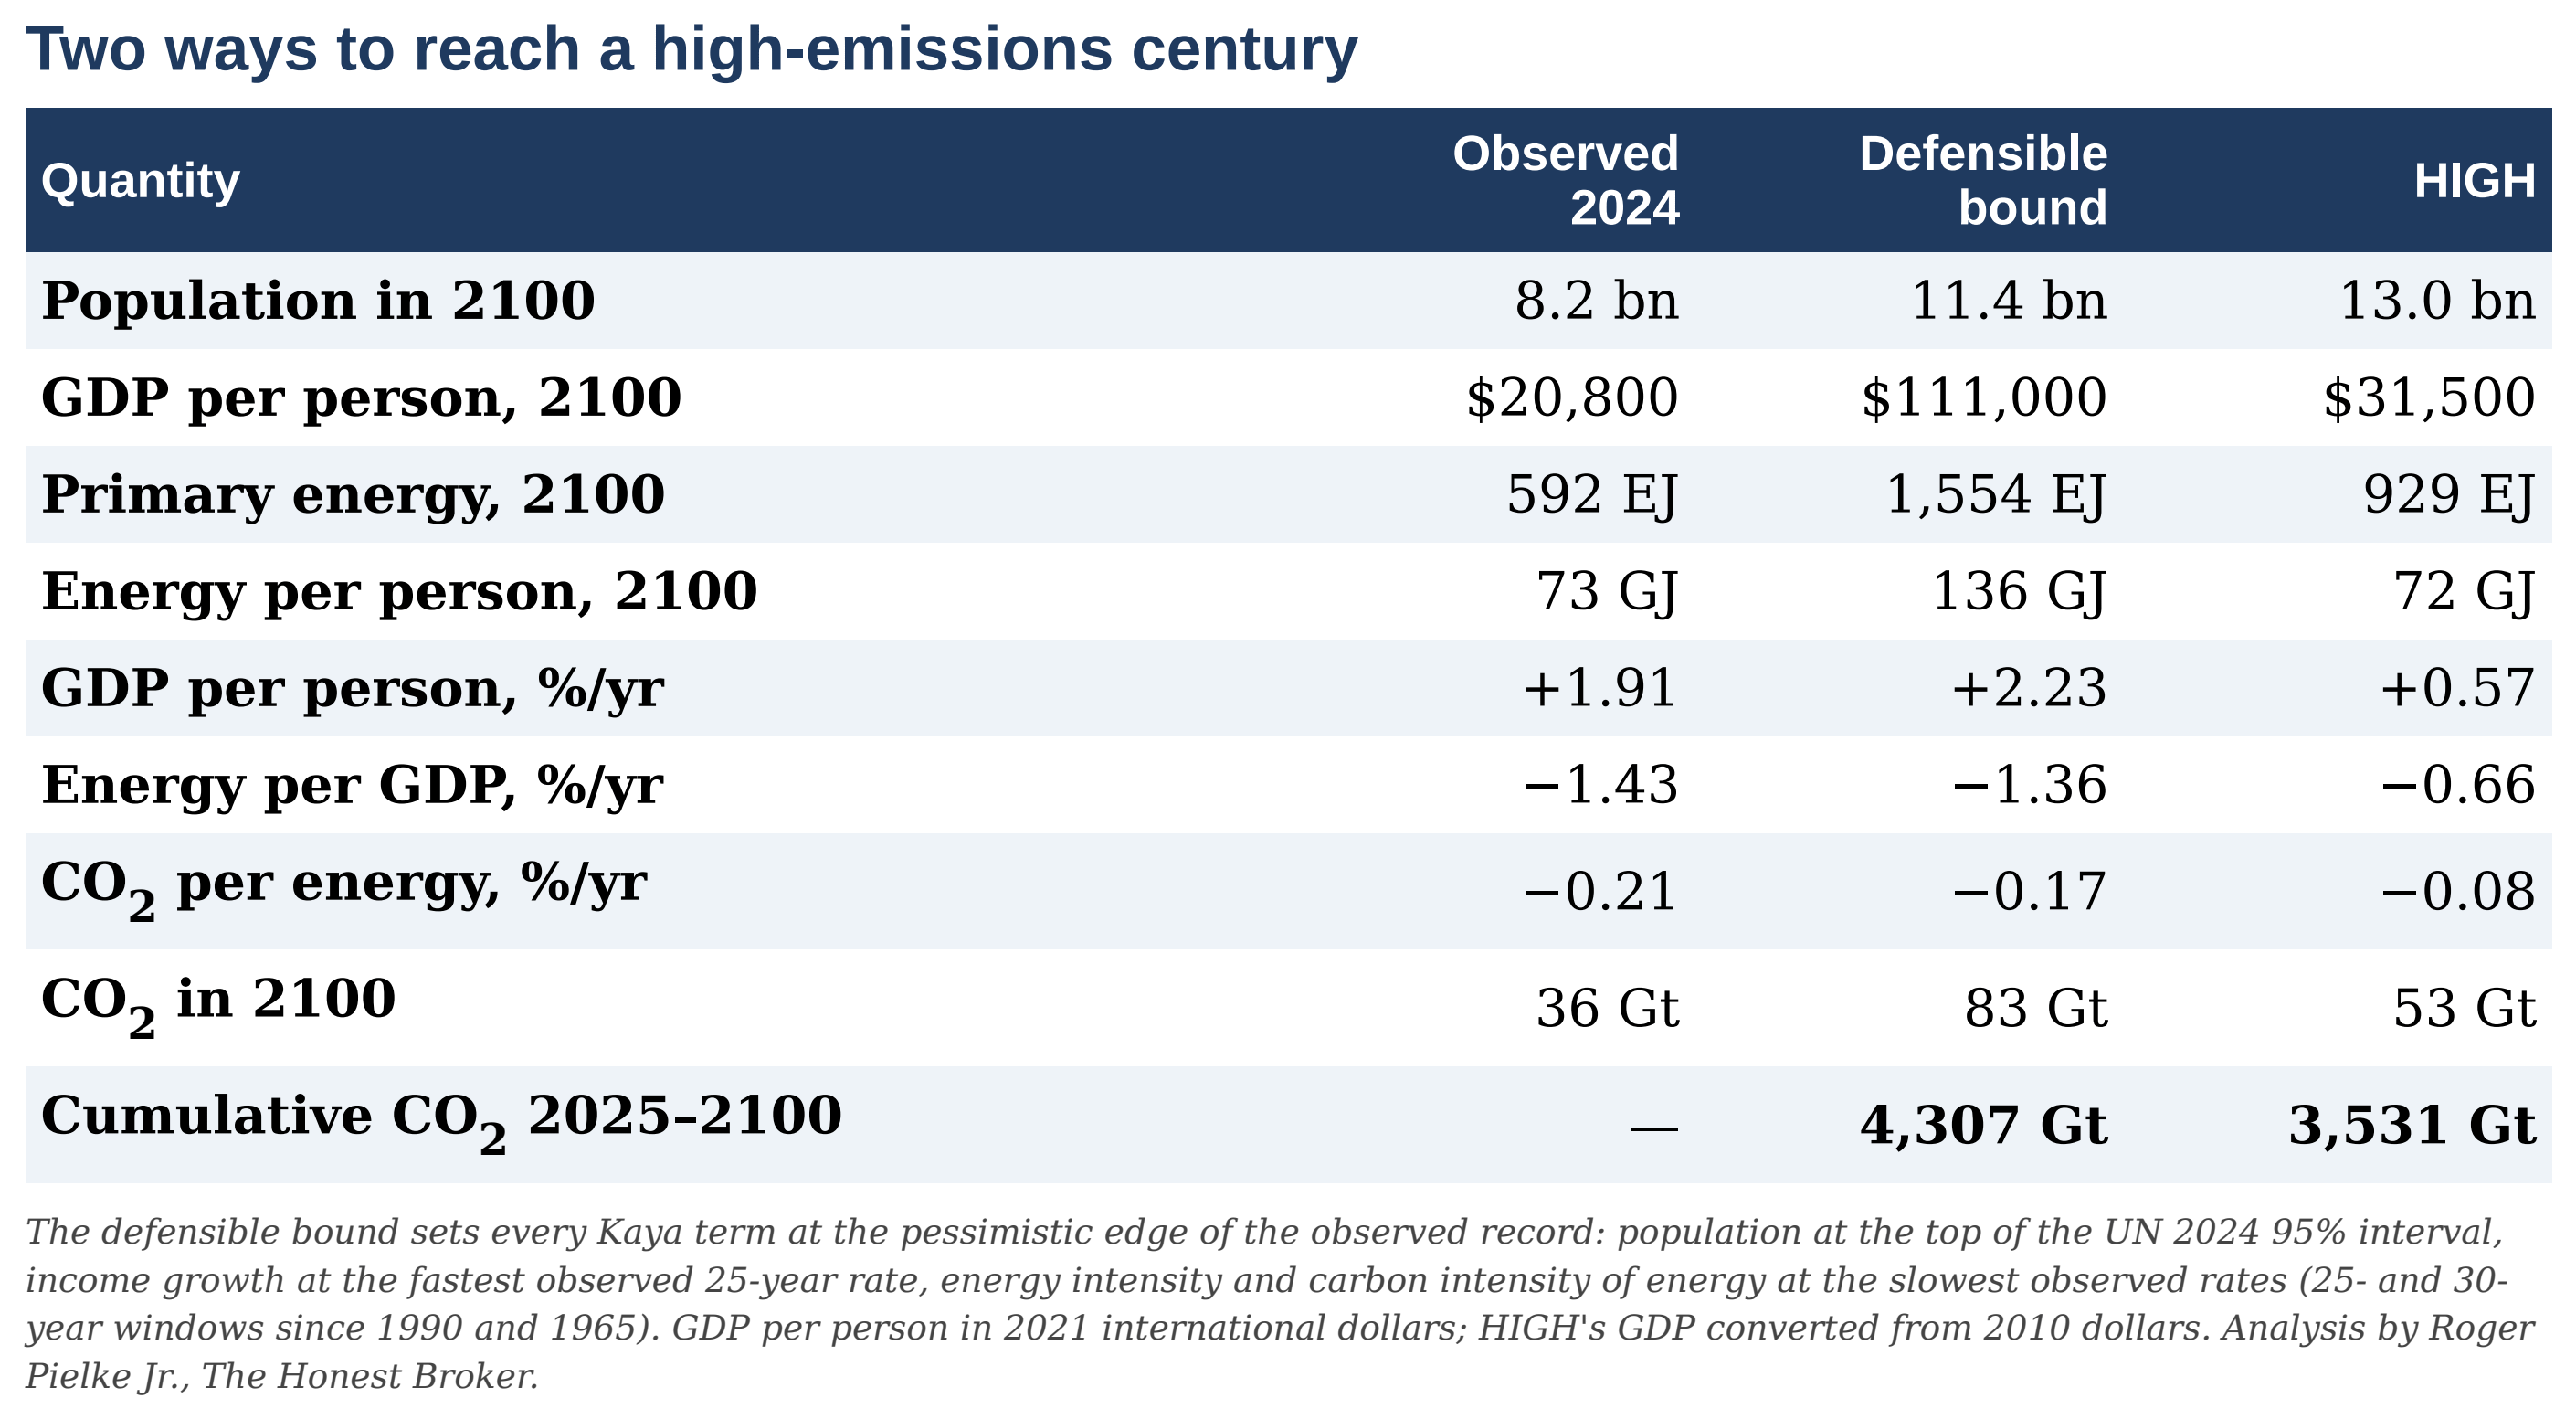
HIGH’s cumulative total sits comfortably inside this simple extrapolation. If we swap in the past decade’s faster decarbonization then the projected cumulative emissions drop to 3,375 GtCO₂, just under HIGH, but still consistent with it.
Cumulative emissions projected by HIGH are highly unlikely, but plausibly reached through a combination of the most pessimistic (for emissions) observed historical Kaya element dynamics.

Later this week, I will introduce Build Your Own Emissions Scenario, a new dashboard where you can build your own version of a CMIP7 emissions scenario, using variables such population, income, energy per dollar and carbon per unit of energy, plus land use and methane, and explore the scenario space yourself.
Here is the bottom line:
Population. SSP3 projects 12.98 billion in 2100, compared to the UN’s median of 10.2 billion and well above the top of the UN’s 95 percent interval, and goes against the direction of every recent UN revisions downward: 11.2 billion in 2017, 10.9 in 2019, 10.2 in 2024.
And the UN projection is likely still too high. My AEI colleague Jesús Fernández-Villaverde has argued persuasively that the UN consistently overestimates fertility for many countries, and that working from national statistical agencies rather than UN estimates puts humanity already below the global replacement rate. He and Patrick Norrick find declining country-specific fertility trends in 219 of 236 countries with no sign of levelling off, and project a peak around 2056 near nine billion — roughly three decades earlier and 1.3 billion lower than the UN.
In fairness, SSP1 and SSP5 at 8.1 billion people in 2100 fall below the bottom of the UN 95% interval, so the SSP set brackets the UN range — but if Fernández-Villaverde is right, SSP1 and SSP5 may not actually bracket a plausible lower end.
However, CMIP7 chose to feature only the highest population assumption in HIGH.
Picking the storyline with the greatest adaptation challenges, expressly to make impacts more “interesting,” builds a negative bias into every downstream use of HIGH. This could be addressed by adding a companion SSP5-based HIGH that is fully developed in parallel to the SSP3 version so users can compare results of using the two scenarios for economic, impacts, and policy.
Technology. HIGH needs the world to improve energy efficiency at a paltry 0.66 percent a year versus 1.43 percent observed since 1990, and to change its fuel mix at an anemic 0.08 percent a year versus 0.21 percent — for the next seventy-five years.
The rapid slowdown in efficiency improvement is the more remarkable of the two claims, because economies have consistently seen much larger improvements regardless of policy. Such improvements follow directly from the shift toward services, from capital turnover, from price incentives, and from ordinary engineering.
No sustained stretch in the record shows the world improving energy intensity as slowly as HIGH requires.
The fuel-mix assumption is similarly puzzling: fossil fuels are responsible for 73 percent of primary energy in 2100, with solar and wind quadrupling but reaching only 11 percent, nuclear declining in absolute terms, and carbon capture comprehensively failing.
I would guess that as the CMIP7 scenario builders moderated the coal assumptions that doomed RCP8.5 and SSP5-8.5, in a new upper-end scenario emissions had to come from somewhere. In place of a coal renaissance they created a world where technological progress in energy simply grinds to a near halt.
That brings us full circle to Ausubel’s critique of IPCC 1990 — right back to technological regression.
Make no mistake, CMIP7 deserves credit for moving the world past its reliance on RCP8.5 and the like. However, they have not yet introduced rigorous evaluation of scenario plausibility as an important step before releasing the replacements out into the world. Given how widely these scenarios will be used in research and policy, that is a major failure.
As I’ve shown here the new scenarios have their own issues that will almost certainly create future challenges for research, communication, and policy.
Jesse Ausubel tells us that it took 35 years to recognize the flawed assumptions of technological regression that first appeared in the initial IPCC BAU scenarios. Let’s make sure that scenario plausibility assessment becomes routine practice much sooner than 35 years from now.
Reminder: Below, paid subscribers can download a PDF and Excel file with all methods and data of this post.
If you made it to the bottom of this long post and think others should also, please click that “❤️ Like” button.
Appreciated!