Multicollinearity refers to the high correlation between explanatory variables in a linear regression model. Although the OLS method’s parameter estimator is still a linear unbiased estimator, its stability is very poor. A common cause of multicollinearity is the introduction of common trends and lag terms.
The variance inflation factor (VIF) indicates the degree of the multicollinearity issue. Specifically, the greater the VIF, the worse the multicollinearity. A general rule is that the maximum VIF should not exceed ten (Daoud, 2017). The maximum VIF for the explanatory variables in this paper is 1.70, which is much less than 10, indicating that there is no multicollinearity (see Table 3).
Unit root test
If a time series has a unit root, it is non-stationary. In this case, the regression is a pseudo-regression, and the t-test is invalid. To avoid such issues, it is advisable to run unit root tests on the variables. In this paper, we use the LLC test, IPS test, and ADF test to see if variables have a tendency to regress to their long-term means over time. The unit root test results show that all series are stationary (see Table 4).
Dynamic panel system GMM model specification
When investigating the role of ODA on the ecological environment of recipient countries, it is necessary to consider both the economic and energy dimensions. The effects and direction of impact of aid can vary greatly for countries at different stages of economic development and energy use levels. The dynamic threshold model divides the sample data into different groups using the estimated threshold, which is more objective and reasonable than the manual division. This model examines whether there is a threshold effect or not and identifies observing differences between subgroups. The dynamic threshold model investigates the non-linear relationship between ODA and the recipient country’s ecological environment, using agricultural economic development and renewable energy development as threshold variables.
A lag term for ecological pressure is introduced to test the heterogeneity effect of ODA on ecological pressure in recipient countries. The dynamic panel model includes the explained variable’s lag term, where their coefficients can be estimated using the dynamic panel GMM method. Under this setting, endogenous explanatory variables are allowed to exist. We take the natural logarithm of all variables to avoid false regression and eliminate heteroscedasticity. The dynamic threshold panel model is shown as follows:
$$\begin{array}{l}{{earth}}_{{it}}=\theta +{\alpha }_{1}{{earth}}_{{it}-1}+{\gamma }_{1}{{oda}}_{{it}}I\left({agri}\,\le\, \delta \right)\\\qquad\qquad+\,{\gamma }_{2}{{oda}}_{{it}}I({agri} > \delta )+{\beta }_{1}{{urb}}_{{it}}\\\qquad\qquad+\,{\beta }_{2}{{gdpi}}_{{it}}+{\beta }_{3}{{agri}}_{{it}}+{\beta }_{4}{{open}}_{{it}}+{\mu }_{i}+{v}_{t}+{\varepsilon }_{{it}}\end{array}$$
(1)
$$\begin{array}{l}{{earth}}_{{it}}=\theta +{\alpha }_{1}{{earth}}_{{it}-1}+{\gamma }_{1}{{oda}}_{{it}}I\left({rnew}\,\le\, \delta \right)\\\qquad\qquad+\,{\gamma }_{2}{{oda}}_{{it}}I({rnew} > \delta )+{\beta }_{1}{{urb}}_{{it}}\\\qquad\qquad+\,{\beta }_{2}{{gdpi}}_{{it}}+{\beta }_{3}{{agri}}_{{it}}+{\beta }_{4}{{open}}_{{it}}+{\mu }_{i}+{v}_{t}+{\varepsilon }_{{it}}\end{array}$$
(2)
Where \(I(* )\) is the indicator function, which means the value in the corresponding brackets is set to one and the condition which is not set to 0. The regimes are distinguished by differing regression slopes \({\gamma }_{1}\) and \({\gamma }_{2}\). Therefore, the observations are divided into two regimes depending on whether the threshold variable agri and rnew are smaller or larger than the threshold δ. \({\beta }_{1}-{\beta }_{4}\) are the estimated parameters of the control variable. μ represents the individual effect term, which is used to control the characteristics of regional heterogeneity; v represents the time-specific effect term; ε represents the random error term.
Analysis of results
Hansen’s panel threshold estimation method proposed by Hansen is only applicable to the static panel model. The GMM method, on the other hand, is used to calculate interval parameters, which can then be used to calculate dynamic panel thresholds. Tables 5 and 6 show the results. Both Formulas 1 and 2 exhibit a single threshold effect. Figure 1 depicts the likelihood ratio function graph, which displays the model’s threshold estimation and confidence interval calculation results. When the threshold variable is agricultural economy dependence, the estimated threshold value is 3.605. When the threshold variable is renewable energy development, the estimated threshold value is 4.179 with a confidence interval of [4.165,4.181].
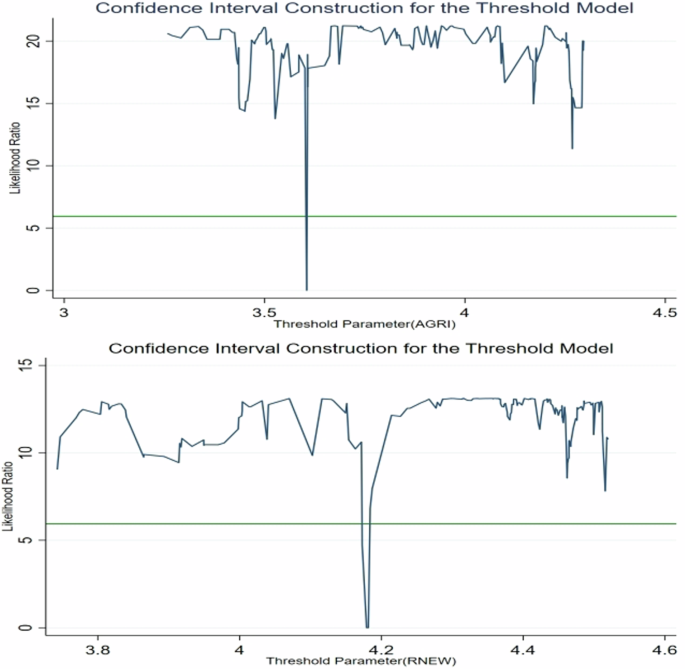
Likelihood function images of single threshold.
A lag term of the explained variable was introduced to test the non-linear threshold heterogeneity effect of ODA on ecological pressure. AR (1), AR (2) (see Tables 7 and 8) and the Sargan test demonstrate that the setting of non-linear dynamic threshold model provides robust estimations. As a result, it can be concluded that ODA has a significant threshold effect on recipient countries’ ecological pressure. The threshold is divided into two parts based on the economic dimension index and the energy-economic index. In other words, because of the threshold effect, it is not possible to build a curve model that is applicable to all countries like the traditional EKC model.
We discovered that ODA has various aid effects on the ecology of African countries due to their reliance on agricultural economies and the development of renewable energy. However, the coefficients of ODA are all negative, indicating that is, ODA improves the ecological environment of recipient countries, which means Hypothesis 1 is verified.
Analysis from the perspective of the economic dimension
Table 5 displays the regression results of the model with the agricultural economy as the threshold variable. Under the condition of a single threshold, the coefficient of the lag term of ecological pressure and the core explanatory variable (ODA) are significant, which can be written as AR(1), AR(2). The Sargan test (Prob > Chi2 = 0.97) indicates that the setting of non-linear dynamic threshold model has high stability.
Using the economic dimension as the threshold variable, the degree of ODA’s impact on environmental pressures in recipient countries will vary. When agricultural economy dependence falls below the threshold (3.605), ecological pressure is reduced by 0.015% for every 1% increase in ODA.
When the agricultural economy’s reliance exceeds the threshold value (3.605), the coefficient of ODA is −0.025%, that is, every 1% increase in ODA reduces the ecological pressure on recipient countries by about 0.025%. ODA has a positive impact on environmental pressures in recipient countries. The intensity of ODA’s stress relief increased as the threshold variable exceeded the threshold values. This has a greater positive impact on the ecological environment of the recipient countries. According to the threshold variable of agricultural economy dependence, ODA can effectively reduce recipient countries’ ecological pressure.
To summarize, the greater the recipient country’s reliance on agriculture, the greater the pressure reduction effect is. This conclusion is essentially consistent with the Solow- and Harrod Domar growth models: aid promotes environmentally sustainable development (Asongu and Nwachukwu, 2016).
In general, the OECD and DAC should provide targeted assistance to countries with positive aid effects. In particular, ODA is especially important for reducing rural poverty and promoting agricultural development in recipient countries. This chapter categorizes the recipient countries in terms of agricultural economic development, and demonstrates the feasibility of the OECD expanding the international aid system to the recipient countries’ agricultural economic development. The empirical findings indicate that countries with a high reliance on agriculture have greater potential for environmental improvement.
Agriculture on various land types is an important component of Africa’s ecological environment in Africa. Agricultural land resources are scarce and irreplaceable, and they are the foundation of African society’s survival and development. Agriculture continues to be a major sector in many African economies, providing employment, food, and income to the most vulnerable countries. However, the human grab for land resources, combined with the fact that the vast majority of African agricultural practitioners in Africa are small producers, makes it difficult to resist the risks of climate and social events. This will undoubtedly place African countries in a precarious position of ecological vulnerability and climate crisis. The dispersed construction of rural settlements in Africa, combined with the continent’s poor ability to withstand natural disasters, has exacerbated the instability of cultivated land (Goyal and Nash, 2017; Hadebe et al., 2017). Due to the threshold effect, ODA produces better improvement effects in recipient countries that are more dependent on the agricultural economy (Suri and Udry, 2022). For the study of the international aid system, differences in agricultural development are an important reason why it is not possible to build a model that is applicable to all countries. Countries with a high reliance on agricultural economies for ODA have a greater potential for environmental improvement. Hypothesis 2 is valid.
Analysis from the perspective of energy dimension
Under the condition of a single threshold, the coefficient of the lag term of ecological pressure and the core explanatory variable (ODA) are significant. The AR(1), AR(2), and Sargan tests (Prob > Chi2 = 0.91) show that the setting of the non-linear dynamic threshold model with renewable energy development as the threshold variable also has strong stability.
Using renewable energy development, an indicator of energy dimension, as a threshold variable, the degree of ODA’s impact on the recipient countries’ ecological pressure will change. When renewable energy development falls below the threshold (4.179), the ecological pressure decreases by about 0.009% for every 1% increase in ODA. When renewable energy development exceeds the threshold (4.179), every 1% increase in ODA reduces the ecological pressure on recipient countries by approximately 0.021% (see Table 6). As a result, the degree of ecological pressure reduction of ODA increases. This has a greater impact on improving the recipient countries’ ecological environments. The relationship between ODA and ecological pressure showed a monotonically decreasing trend when the samples were divided.
One of the goals of African aid is to assist African countries in adapting to climate change. Renewable energy offers a cleaner, more sustainable, dependable, and low-carbon energy development model. The proportion of renewable energy consumption in total final energy consumption reflects the energy mix of a recipient country’s energy mix (Shah et al., 2023).
The most important energy driving force for African countries in the early stages of industrialization is still non-renewable energy, represented by fossil energy (Shah et al., 2024a). For countries that rely heavily on fossil fuels, the resource allocation of large-scale traditional energy industries promotes industrial efficiency and increases the industry’s marginal benefit. Indeed, since the turn of the 21st century, the OECD has gradually incorporated “promoting the development of renewable energy in African countries” under the guise of climate aid into its main line of assistance.
Discussion
According to the FAO, African countries that are most sensitive to ecological changes usually rely more on the agricultural sector for their finances. These countries also have more urgent needs for agricultural economic development, such as rural infrastructure construction, increasing farmers’ income, and sustained, stable, and progressive agriculture (Muiderman et al., 2023). Grants, concessional loans, and technical assistance are all part of ODA and have become important sources of external assistance means and technical assistance for African countries seeking to achieve sustainable agricultural development.
Previously, African countries’ high reliance on fossil energy had resulted in a carbon emission scale effect. This effect’s self-reinforcing and self-enclosing mechanism effect may constrain the development of the renewable energy industry, resulting in higher economic costs for converting the existing energy mix to rising renewable energy (Chapel, 2022). Previous studies confirm the results that ODA can flow efficiently into renewable energy for countries with higher levels of renewable energy development (Guo et al., 2024). The coefficient estimation results suggest that countries that are stable aid recipients make a stepwise jump. Aid donors should take a long-term view and develop long-term stable aid programmes.
The data for this study begins in 2005, the year ODA began integrating the Green Climate Fund. The cut-off date is 2017. The objective of this study is to assess aid performance, challenges and outcomes after the expiry of the 2030 UN Agenda for Sustainable Development. Therefore, in order to assess aid effectiveness, this study needs to be followed up continuously and the data needs to be updated in real-time.
The results of empirical studies show that aid is more effective when it is provided to recipient countries that have a sound base of economic and energy development. But should this mean that countries that are lagging behind should be ignored? If assistance to those lagging countries is abandoned, the non-reimbursable and altruistic nature of assistance will be greatly undermined. The next step should be to prioritize aid for the well-developed and lagging countries in order to achieve an optimal balance.