This was a cross-sectional study that employed a prevalence-based approach to estimate the economic burden of T2D and its attributable complications in adults aged 20 years and older in Iran for 2022. The prevalence-based approach involved first estimating the prevalence of T2D and its associated complications, and then multiplying these prevalence estimates by the average annually cost per patient to calculate the overall economic burden. This method has been widely used in similar studies and provides a comprehensive understanding of the economic impact of the disease. Both direct medical costs and indirect costs were considered in present analysis. Direct medical costs included inpatient and outpatient costs attributable to Type 2diabetes and its complications, while indirect costs encompassed absenteeism, presenteeism, inability to work, and premature mortality costs due to the disease.
Prevalence estimation of T2D and complicationsT2D prevalence
The prevalence of T2D by age and gender in Iran was estimated using the data from the Global Burden of Disease (GBD) Study [15].
Complications attributed to T2D
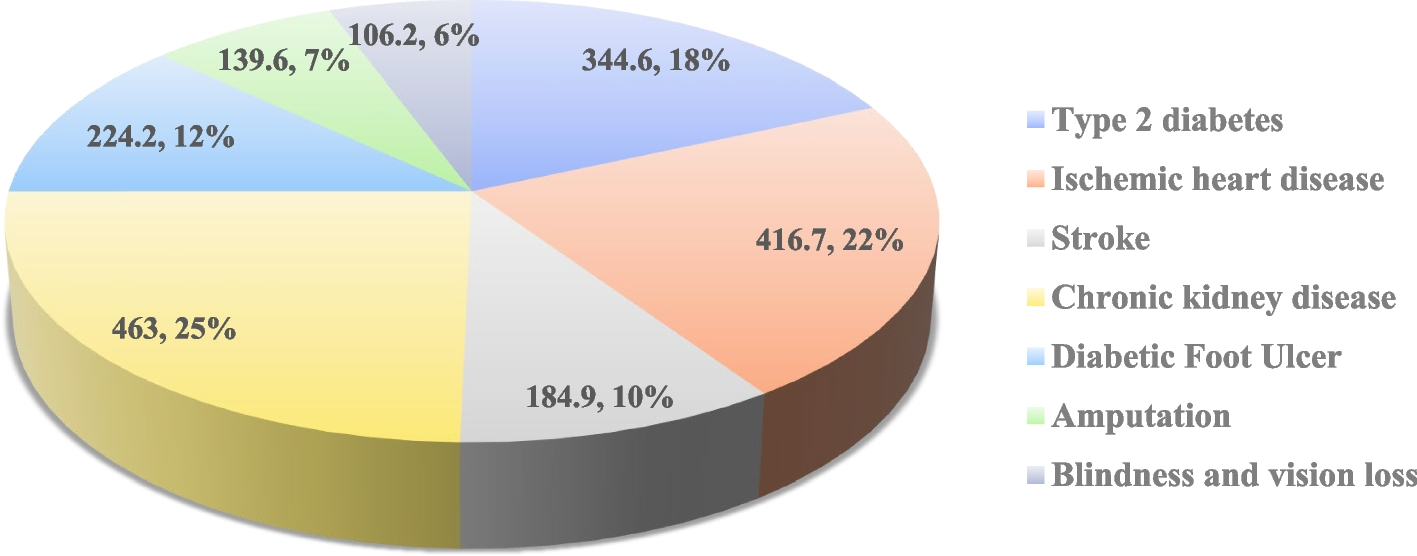
A significant part of the costs of T2D is due to its complications. Type 2 diabetes is associated with a range of complications, which can be broadly categorized into macrovascular and microvascular complications. Macrovascular complications include cardiovascular disease, such as ischemic heart disease and stroke, which can lead to significant morbidity and mortality. Microvascular complications, on the other hand, include chronic kidney disease, diabetic foot ulcer, amputation, blindness, and vision loss. In this study, we estimated the prevalence of these complications attributed to diabetes and the costs associated with them.
The GBD study does not directly estimate the prevalence of complications attributed to T2D. To address this limitation, we employed an indirect approach utilizing the GBD study’s estimation of disability-adjusted life years (DALYs) attributed to High fasting plasma glucose (HFPG), defined as 4.88–5.30 mmol/L in the GBD Study. We assumed that the share of DALYs attributable to HFPG out of the total DALYs for each complication could be generalized to estimate the share of those complications’ prevalence attributable to T2D. we used the following equation to estimate the prevalence of complications attributed to T2D in Iran:
$$\text{PC} = \sum\nolimits_{{\varvec{i}} = \varvec{1}}^{\varvec{8}} \sum\nolimits_{{\varvec{g}}=\varvec{1}}^{\varvec{2}} \sum\nolimits_{{\varvec{c}} = \varvec{1}}^{\varvec{6}}{{\varvec{S}}}_{{\varvec{i}}{\varvec{g}}{\varvec{c}}}\boldsymbol{*}{{\varvec{N}}}_{{\varvec{i}}{\varvec{g}}{\varvec{c}}}$$
In this equation, PC represents the prevalence of complications attributed to T2D in Iran, i represents the age group, g the gender, c represents the complications attributed to diabetes (including ischemic heart disease, stroke, chronic kidney disease, diabetic foot ulcer, amputation, blindness, and vision loss), S represents the share of DALYs attributed to HFPG out of the total DALYs for the complication, and N represents the prevalence of the complication in Iran.
For instance, in the case of stroke, we calculated the share of stroke DALYs attributed to HFPG from the total stroke DALYs by age and sex. Then by multiplying these calculated shares by the total number of stroke prevalence cases in Iran, also stratified by age and sex, we estimated the number of stroke cases specifically associated with T2D.
Estimating the direct medical costs attributable to diabetes
Direct medical costs refer to the expenses incurred by the healthcare system, patients, and their families for the diagnosis, treatment, and management of a specific disease. We estimated the total direct medical costs attributable to T2D in Iran using the following equation:
$$\text{DMC} = \sum\nolimits_{{\varvec{i}} = \varvec{1}}^{\varvec{8}} \sum\nolimits_{{\varvec{g}} = \varvec{1}}^{\varvec{2}}{\sum\nolimits_{{\varvec{c}}=\varvec{1}}^{\varvec{7}}{\varvec{A}}{\varvec{M}}{\varvec{C}}_{{\varvec{c}}}}\boldsymbol{*}{{\varvec{N}}}_{{\varvec{i}}{\varvec{g}}{\varvec{c}}}$$
where DMC indicates the total direct medical costs attributable to T2D, i the age group, g the gender, c the T2D and attributed complications, AMC the average direct medical costs per patient per year, and N represents the prevalence of condition c in age group i and sex g in Iran. The direct medical costs estimates in this study include the costs of hospitalization, medical tests (including laboratory tests and imaging studies), medications, medical equipment, and other outpatient medical services.
The average direct medical costs per prevalence case per year for each condition were extracted from previous studies conducted in Iran [16,17,18,19,20,21]. A comprehensive literature review was performed to identify the most recent and reliable cost estimates (Table S1 Supplementary material). Since most studies were conducted in previous years, we adjusted all costs based on the health sector price index extracted from the Iran Statistics Center and converted them to 2022 prices.
Regarding T2D specifically, we were unable to find any valid studies on resource consumption among diabetic patients in Iran. Considering that the major costs are typically associated with medication treatments, we extracted sales statistics for diabetes drugs from the annual pharmaceutical statistics of Iran in 2022 [22]. Diabetes drugs were identified using the ATC classification system, in consultation with clinical experts. Furthermore, based on the findings of Parker et al.’s study in the US, we assumed that Type 2 diabetic patients, on average, had one physician visit and 0.03 days of hospital stay per year [23]. The average cost per physician visit and hospital stay was obtained from approved medical services tariffs in Iran.
In the case of chronic kidney disease (CKD), previous studies in Iran had only reported the average cost per dialysis patient, and the average cost for stages 3 to 5 of the disease was not available. Vivekanand Jha et al. estimated the mean annually cost per CKD patient across different stages across 31 countries/ regions. By using the ratios of the cost of each CKD stage to the cost of dialysis from Vivekanand Jha et al.’s study, we multiplied these ratios by the average cost of dialysis in Iran to calculate the average annual cost of CKD patients by disease stage [24]. Also, the proportion of different stages of CKD were extracted from previous literature [25, 26].
Estimating the indirect costs attributable to diabetes
The indirect costs associated with diabetes include costs from workdays missed due to health conditions (absenteeism), reduced work productivity while working due to health conditions (presenteeism), reduced workforce participation due to disability, and lost productivity due to premature mortality.
Absenteeism
Absenteeism refers to the loss of productivity or workdays missed by individuals due to a particular illness or health condition. Absenteeism is often measured in terms of the number of days or hours of work lost and the associated income or productivity lost due to absence from work. In this study, the total absenteeism cost was estimated using the following equation:
$$\mathbf{Absenteeism}\ \mathbf{cost} = \sum\nolimits_{{\varvec{i}} = \varvec{1}}^{\varvec{8}} \sum\nolimits_{{\varvec{g}} = \varvec{1}}^{\varvec{2}}{{\varvec{M}}}_{{\varvec{i}}{\varvec{g}}}\boldsymbol{*}{{\varvec{P}}}_{{\varvec{i}}{\varvec{g}}}\boldsymbol{*}{{\varvec{W}}}_{{\varvec{i}}{\varvec{g}}}\boldsymbol{*}{{\varvec{N}}}_{{\varvec{i}}{\varvec{g}}}$$
In this equation, M represents the average number of workdays missed per diabetic patient per year, P the workforce participation rate, W the daily wage, N number of Type 2 diabetic patients, g the gender, and i represents the age group.
In a systematic review and meta-analysis conducted by Bommer et al., the average number of workdays missed per diabetic patient per year in low and middle-income countries in the MENA region was estimated to be 2.8 days for both sexes and all ages [11]. We used the Bommer et al. estimation in our study. The economic participation rate and daily wage by age and gender were extracted from the reports of the Iran Statistics Center [27].
Presenteeism
Presenteeism refers to the loss of productivity that occurs when individuals are present at work but are functioning at a reduced capacity due to a health condition or illness. Presenteeism captures the concept that even though an individual is physically present at their workplace, their illness may hinder their ability to perform tasks effectively, leading to decreased productivity. We estimated the total presenteeism cost using the following equation:
$$\mathbf{Presenteeism}\ \mathbf{cost} = \sum\nolimits_{{\varvec{i}} = \varvec{1}}^{\varvec{8}} \sum\nolimits_{{\varvec{g}} = \varvec{1}}^{\varvec{2}}{{\varvec{R}}}_{{\varvec{i}}{\varvec{g}}}\boldsymbol{*}{{\varvec{P}}}_{{\varvec{i}}{\varvec{g}}}\boldsymbol{*}{{\varvec{W}}}_{{\varvec{i}}{\varvec{g}}}\boldsymbol{*}{{\varvec{N}}}_{{\varvec{i}}{\varvec{g}}}$$
In this equation, R represents the percent of reduced productivity while at work, P the workforce participation rate, W the yearly wage, N number of Type 2 diabetic patients, g the gender, and i represents the age group. According to the Bommer et al. study results, the productivity shortfall in Type 2 diabetic patients in low and middle-income countries in the MENA region was 0.6 and 1 percent in males and females respectively [11].
Inability to work
Inability to Work refers to the situation where individuals are unable to participate in the workforce or maintain employment due to a health condition or illness. This concept captures the long-term impact of a disease on an individual’s ability to work and earn an income, leading to potential income loss and reduced economic productivity. We estimated the total Inability to Work cost using the following equation:
$$\mathbf{Inability}\ \mathbf{to}\ \mathbf{Work}\ \mathbf{cost} = \sum\nolimits_{{\varvec{i}}=\varvec{1}}^{\varvec{8}} \sum\nolimits_{{\varvec{g}} = \varvec{1}}^{\varvec{2}}{{\varvec{L}}}_{{\varvec{i}}{\varvec{g}}}\boldsymbol{*}{{\varvec{P}}}_{{\varvec{i}}{\varvec{g}}}\boldsymbol{*}{{\varvec{W}}}_{{\varvec{i}}{\varvec{g}}}\boldsymbol{*}{{\varvec{N}}}_{{\varvec{i}}{\varvec{g}}}$$
In this equation, L represents the percent of reduced labor force participation, P the workforce participation rate, W the yearly wage, N number of Type 2 diabetic patients, g the gender, and i represents the age group. According to the Bommer et al. study results, the percent of reduced labor force participation in Type 2 diabetic patients in low and middle-income countries in the MENA region were 1.1 and 13.2 percent for males 20–39 years and 40- 65 years respectively. For females aged 20–39 years and 40- 65 years, the rates were 1.2 and 17.4 percent respectively [11].
Premature mortality
Premature Mortality cost refers to the economic value of lost productivity or income due to premature deaths caused by a particular disease or health condition. The human capital approach was employed to estimate premature mortality costs using the following equation:
$$\text{Premature Mortality Cost} = \left(\sum\nolimits_{{\varvec{i}} = \varvec{1}}^{\varvec{8}} \sum\nolimits_{{\varvec{g}}=\varvec{1}}^{\varvec{2}} \sum\nolimits_{c=1}^{5} \sum\nolimits_{le=1}^{60}{AAI}_{ig}*{{\varvec{N}}}_{{\varvec{i}}{\varvec{g}}{\varvec{c}}}*{{\varvec{P}}}_{{\varvec{i}}{\varvec{g}}}\right)/({1+DR)}^{t}$$
where i indicates the age group, g the gender, c the T2D and attributed complications, AAI the average annual income or productivity value, N represents the number of premature deaths, P the workforce participation rate, le remaining life expectancy and DR indicates the Discount Rate.
The number of premature deaths attributed to diabetes was obtained from the GBD study [15], and the remaining life expectancy of those individuals was estimated using Iranian life tables [28]. Future cost was discounted to present value using a 5% annual discount rate.
All costs were adjusted to 2022 values using appropriate inflation rates and converted to US dollars (USD) using the official market exchange rate (US$ 1 = IR Rial 252,362) and Purchasing Power Parity (PPP) exchange rate (US$ 1 = IR Rial 71,027) for 2022 [29].
Sensitivity analysis
To assess uncertainty, we performed a sensitivity analysis using the 95% confidence interval estimated for the prevalence and mortality of diabetes and its associated complications. To avoid complexity, we did not consider additional uncertainties arising from other parameters such as average medical cost, workforce participation, average income, etc.