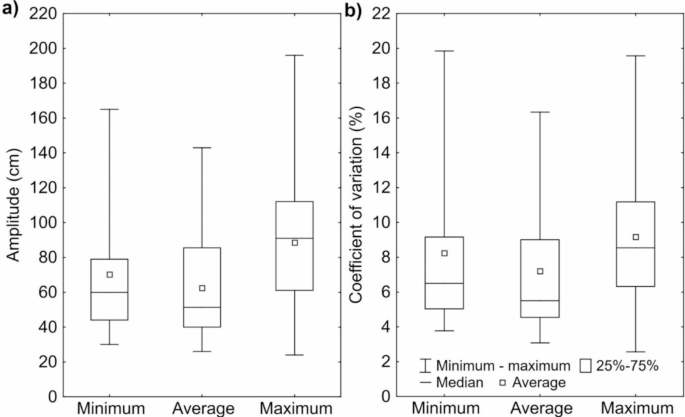
The variability of water levels in the studied lakes over the period 1963–2022 was diverse. The lowest variability of average water levels was characteristic of Lakes Łebsko, Ostrzyckie, Białe Augustowskie, and Studzieniczne (coefficient of variation was below 4%), minimum water levels in Lakes Lubie, Łebsko, Charzykowskie, Ostrzyckie, Wigry, and Studzieniczne (coefficient of variation was below 5%), and maximum water levels in Lakes Sławskie, Ostrzyckie, and Studzieniczne. On the other hand, Lake Ełckie had the highest variability in average and maximum water levels, and Lakes Bachotek and Serwy in minimum water levels. Generally, the average annual water levels in individual lakes were characterized by the lowest variability, minimum water levels by average variability, and maximum water levels by the highest variability. This is confirmed by the values of their amplitudes (Fig. 2a) and coefficients of variation (Fig. 2b) of minimum, average, and maximum water levels. Statistical analysis using the non-parametric sign test showed significant differences between these parameters at the level of 0.05. In the lakes Lubie, Łebsko, Charzykowskie, Dadaj, and Wigry, the coefficients of variation for minimum, average, and maximum water levels were on average approximately 5%, 5%, and 8%, respectively, with amplitudes of 42 cm, 47 cm, and 74 cm. Generally, these values fall within the second quartile when considering all lakes. Among the lakes where water levels were not controlled by hydraulic structures, the greatest variability in levels was observed in Lake Dadaj.
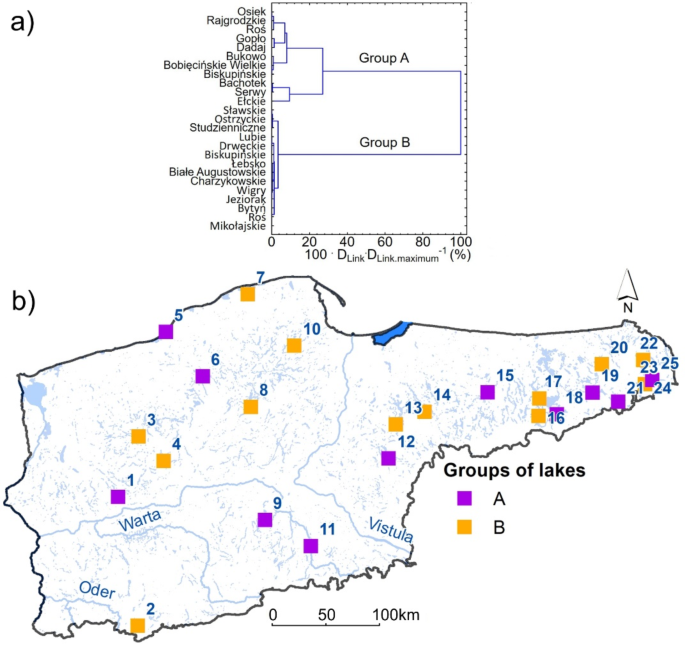
The cluster analysis, enabled to divide the studied lakes into two groups based on the values of coefficients of variations of minimum, average, and maximum water levels (Fig. 3a). Group A includes 11 lakes, and Group B comprises 14 lakes. Lakes included in group A had higher variability of minimum, average and maximum water levels and water level amplitudes. The use of the U Mann-Whitney test indicates that these differences were relevant at a significance level of 0.05. In contrast, the lakes in Groups A and B did not differ by area, maximum depth, average depth and volume. Also, there were no differences in the Schindler Index (SR), Ohle Index (OR), average water exchange time in the lake (ET). The lakes in groups A and B are distributed basically across the entire north Poland border, which suggests a lack of spatial pattern in their distribution (Fig. 3b). The four lakes Lubie, Łebsko, Charzykowskie, and Wigry, where water levels were not controlled, were assigned to group A, while Lake Dadaj was assigned to group B.
However, considering the annual amplitudes of water levels calculated as the difference between the maximum and minimum water levels, they varied from 7 cm in Lakes Studzieniczne and Serwy (respectively in 1981 and 1973) to 194 cm in Lake Gopło (in 2011). Meanwhile, the average annual amplitudes of water levels ranged from 20 cm for Lake Studzieniczne to 96 cm for Lake Rajgrodzkie. The values of the variability coefficients of water level amplitudes in the studied lakes ranged from 15.6 to 53.5%. The lowest variability coefficient of water level amplitudes was obtained for Lake Łebsko and the highest for Lakes Biskupińskie and Bachotek. For Lakes Bobęcińskie, Charzykowskie, Biskupińskie, Gopło, Bachotek Dadaj, Studzieniczne, and Serwy, the variability coefficients of water level amplitudes ranged from 40.2 to 53.5%. Considering the lakes where water levels were not controlled, the minimum amplitudes did not exceed 23 cm, with the exception of Lake Łebsko, which had a value of 60 cm. The maximum amplitudes did not exceed 80 cm, except for Lakes Łebsko and Dadaj, where they were 120 cm and 141 cm, respectively. The coefficients of variability of water level amplitudes ranged from 31.3 to 40.2%, with Lake Łebsko having only 15.6%.
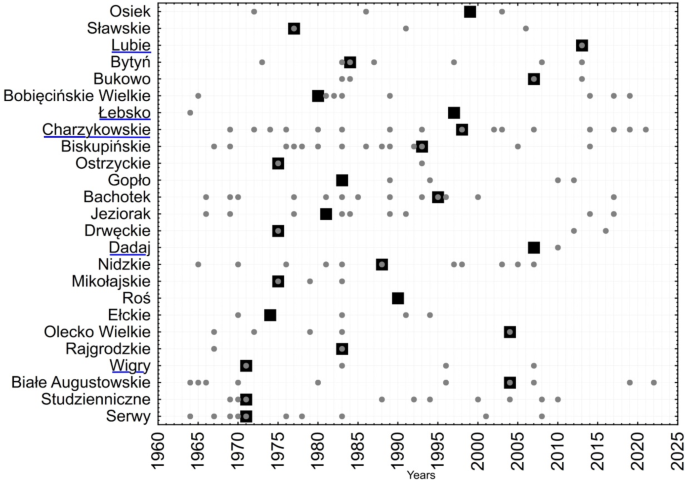
One of the stages of the research was the analysis of the occurrence of change points in the series of annual average water levels in individual lakes using the Pettitt and WBS tests. The former allows for the detection of single change point, while the latter can identify a larger number of such points. Using the Pettitt test, the most change points (for 8 lakes) were identified in the 1970s (Fig. 4 – black rectangle). Six change points were identified in both the 1980s and 1990s. However, in the 21st century, change points were identified only for 5 lakes. Simultaneous analysis of the years in which change points occurred and the distribution of lakes indicates a lack of spatial dependency, suggesting the primary role of local factors, particularly related to hydraulic construction. However, analysis using the WBS test showed that there could be more change points. In the case of Lakes Charzykowskie, Biskupińskie, Bachotek, Nidzkie, Białe Augustowskie, Studzieniczne, and Serwy, the number of change points ranged from 10 to even 16 (Fig. 4 – grey circle). In the case of these lakes, generally high values of variability coefficients of annual water level amplitudes were demonstrated, except for Lake Charzykowskie and Nidzkie. In the lakes Lubie, Łebsko, Dadaj, and Wigry, where water levels were not controlled, the number of breakpoints from the Pettitt test and the WBS method did not exceed 4. An exception in this set is Lake Charzykowskie, which had as many as 16 breakpoints using the WBS method.
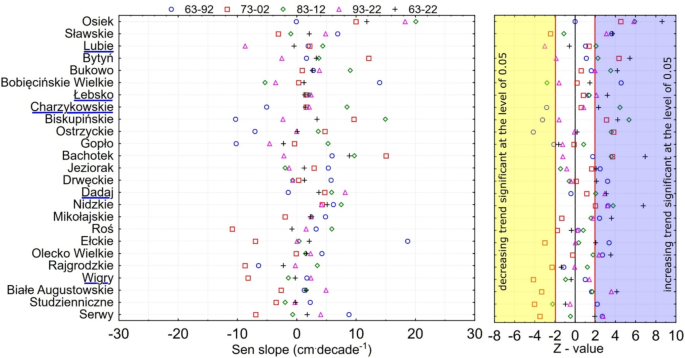
Moving to the main objective of the research, an analysis was conducted on the long-term changes in characteristic water levels and amplitudes. So that the data for all lakes with non-overlapping change points could be analysed together, non-parametric Mann-Kendall and Sen tests (which are resistant to outliers) were applied; in addition, analysis was performed for 30-year periods (1963–1992; 1973–2002, 1983–2012) and for the period 1963–2022. The analysis of long-term changes in average water levels showed that in the four distinguished 30-year periods, from 10 to 14 lakes recorded both increasing and decreasing trends significant at the level of 0.05 (Fig. 5). This is indicated by the points to the left of the vertical red line with a value of -1.96 and the points to the right of the vertical red line with a value of 1.96.
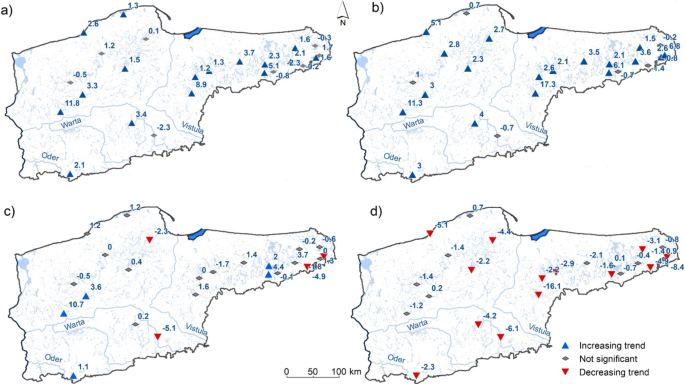
The obtained results indicate that negative trends occurred in the years 1973–2002 in a group of lakes located in the Masurian Lake District in eastern Poland and in Lake Sławskie, and in the years 1963–1992, in Lakes Charzykowskie, Biskupińskie, Ostrzyckie, and Gopło located in central Poland. Generally, however, there is a predominance of rising trends. This mainly pertains to lakes located in the western part of Poland in the years 1983–2012. In the years 1993–2022, an increase in water levels was shown for 9 lakes, which were scattered across western and eastern Poland. In the lakes Łebsko, Charzykowskie, and Dadaj, where water levels were not controlled, an increasing trend in average water levels was also observed. In the other two lakes in this group, the changes were not statistically significant. Considering the entire analysis period, i.e., the years 1963–2022, for 16 lakes, the occurrence of rising trends was demonstrated, ranging from 1.2 to 11.8 cm per decade, with an average value of about 3.5 cm per decade.
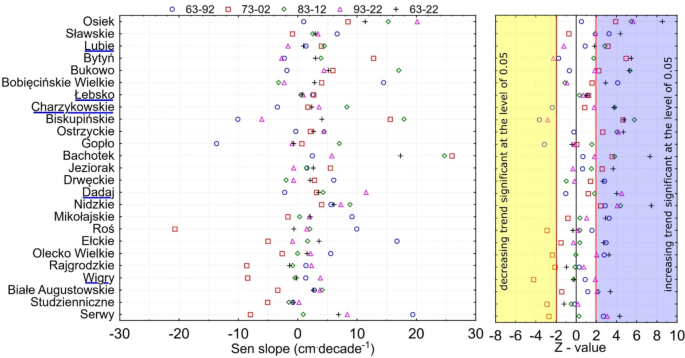
For minimum water levels in individual periods, significant changes at the level of 0.05 were observed in 9 to 15 lakes, with the most changes noted in the periods 1963–1992 and 1973–2002, with 11 and 15 changes respectively (Fig. 6). In lakes in eastern Poland, similar to average water levels, a decreasing trend was observed in the period 1973–2002, while the opposite situation occurred in lakes in western and central Poland. In individual lakes in central Poland, a decreasing trend occurred in the period 1963–1992. In the period 1993–2022, an increasing trend was noted in 7 lakes, which were scattered throughout Poland. The lakes where water levels were not controlled exhibited varied directions of change over 30-year periods, with significant increases and decreases observed. However, more often, there were no changes in minimum water levels. Considering the entire analysis period, as many as 18 lakes showed an increasing trend of minimum water levels ranging from 1.5 to 17.3 cm per decade, with an average value of about 4.6 cm per decade. Of the lakes where water levels were not controlled, an increase in minimum water levels occurred only in Lakes Charzykowskie and Dadaj.
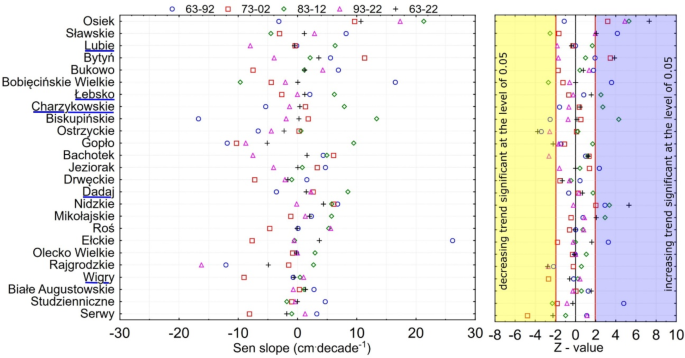
The study showed that the smallest changes occurred in the case of maximum water levels, where only 5 to 9 lakes in each of the 30-year periods showed significant changes at the level of 0.05 (Fig. 7). In the lakes where water levels were not controlled, over 30-year periods, the changes in maximum water levels were not significant for Lakes Lubie and Dadaj. However, in Lakes Łebsko and Charzykowskie, a significant increasing trend was observed during the period 1982–2012, while in Lake Wigry, a significant decreasing trend was noted from 1972 to 2002.
In terms of maximum water levels, the directions of changes generally do not coincide with those previously shown for minimum and average water levels. Also, the analysis of the entire span of 1963–2022 indicates variability in trends. For 4 lakes, decreasing trends were shown ranging from − 5.1 to -1.8 cm per decade, with an average value of about − 3.5 cm per decade, and for 5 lakes, an increasing trend ranging from 2.0 to 10.7 cm per decade, with an average value of about 5.2 cm per decade. In the lakes where water levels were not controlled, no significant changes in maximum water levels occurred.
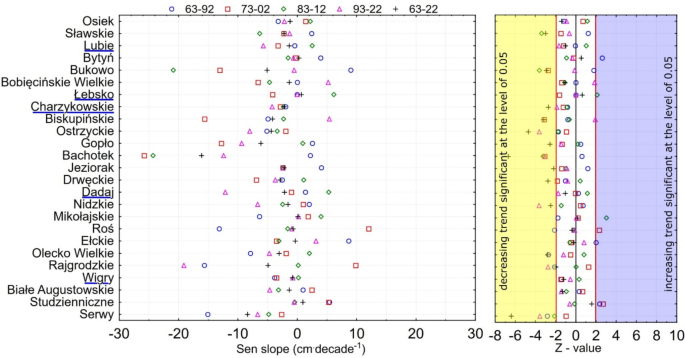
Analysis of the amplitudes of water level changes in lakes over 30-year periods showed significant changes at the level of 0.05 only for a set of 5 to 7 lakes. Generally, it was determined that lakes predominantly showed a trend towards a reduction in water level fluctuations. Only in a few cases in the 30-year periods did the annual rhythm of water level changes show an increasing tendency (Fig. 8). However, considering the entire analysis period, i.e., the years 1963–2022, for 13 lakes a statistical significant at the level of 0.05 decreasing trend was shown in relation to water level amplitudes ranging from − 16.1 to -1.6 cm per decade, with an average value of about − 4.6 cm per decade. Particularly in the lakes of central Poland, these changes applied to practically all lakes. The spatial differentiation of water level trends and water level amplitudes in the years 1963–2022 is presented in Fig. 9. In the lakes Lubie, Łebsko, Dadaj, and Wigry, where water levels are not controlled, changes in amplitudes over different periods were not statistically significant. However, in Lake Charzykowskie, a decreasing trend in amplitudes was observed for the period 1963–2022.
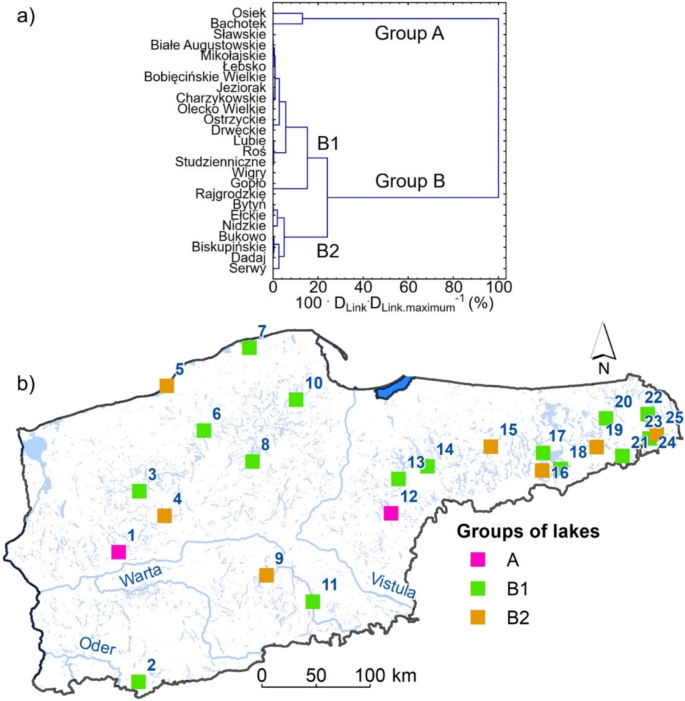
Considering the extent of water levels changes and amplitudes of water levels changes, the lakes can be divided into two groups (Fig. 10). Group A includes only 2 lakes, Osiek and Bachotek (Fig. 10a). Group B comprises 23 lakes, which can be divided into 2 subgroups, B1 and B2. In general, lakes classified into subgroup B1 were characterized by a higher increase in minimum, mean and maximum water levels than lakes classified into subgroup B2. Also, changes in the amplitudes of water levels were more dynamic in the lakes of group B1 than B2. Moreover the results of cluster analysis indicate a lack of regional character in the changes (Fig. 10b). The lakes Łebsko, Charzykowskie, Lubie, and Wigry, where water levels were not controlled, were classified into group B1, while Lake Dadaj was classified into group B2.
Division of lakes into groups in terms of the magnitude of long-term changes in water levels and amplitudes of water levels (a), along with the presentation of their spatial distribution (b) (the b was generated in ArcGIS Pro v3.1.0 software, https://www.esri.com/en-us/arcgis/products/arcgis-pro/overview).
Trends of water levels and amplitudes of water levels were analysed against the background of trends in atmospheric precipitation sums, where the analysis showed no significant changes in the period 1963–2022. Considering 30-year periods, similarly to water levels, it was established that in the periods 1973–2002 and 1993–2022 there were no significant changes in precipitation. In the period 1963–1992, a negative trend occurred at four meteorological stations: Drawsko Pomorskie, Gorzyń, Kołuda Wielka, and Tomkowo. However, in the period 1983–2012, there was an increasing trend at six meteorological stations: Gorzyń, Chojnice, Łeba, Kołuda Wielka, Tomkowo, and Biebrza. This indicates a lack of correlation between the trends of water levels in lakes and the trends of annual precipitation.
In the final stage of the analysis, an attempt was made to identify factors responsible for the annual and long-term variability of water levels in lakes from 1963 to 2022. For this purpose, lake parameters were analysed (LA – lake area, LAD – lake average depth, LMD – lake maximum depth, LV – lake volume, X – longitude, Y – latitude) and parameters characterising the lake’s catchment area were determined (CTA –total catchment area, CDA –direct catchment area, CR – ratio of the total and direct catchment area, SR – Schindler rario, OR – Ohle ratio, ET – water exchange time, CLD – catchment lakenes, CRD – catchment river density, ArtA – artificial area, AgrA – agricul-ture area, ForA – forest area, WetA – wetland area, WatA – water area, CAA – catchment average altitude, CRA – catchment altitude range, CAS – catchment average slope, CUO – catchment unite outflow, CUUO- underground outflow, PUO-percentage of underground runoff in total unit runoff, CAT – catchment average temperature, CAP – catchment aver-age precipitation, CAE – catchment average water evaporation). Results of the calculations are presented in Table S1.
Performing a correlation analysis only for the 5 lakes where water levels are not disturbed by hydraulic structures showed that: lakes located in catchments with higher unit runoff (CUO) have lower amplitudes of average and high water levels; also, in lakes located in catchments with higher groundwater outflows (CUUO), the coefficients of variation for average and maximum water levels are lower. Additionally, in lakes located in catchments with a higher proportion of groundwater outflow relative to total runoff (PUO), the coefficients of variation for high water levels are lower. The correlation analysis indicated that there are higher amplitudes of water levels in lakes located in catchments with a higher density of river networks (CRD). Considering long-term changes in water levels described by Sen’s slope estimator, the correlation analysis showed that higher changes in maximum water levels are observed in lakes located in catchments with a higher share of agricultural land (AgrA) and a lower share of lakes (CLD). Meanwhile, higher values of Sen’s slope estimator calculated for water level amplitudes are in lakes with a larger surface area (LA), a larger area of direct catchment (CDA), and higher variability in elevation.
In the analysis of lakes whose water levels are influenced by hydraulic structures (20 lakes), it was shown that lakes with greater maximum depth (LMD) experience larger amplitudes of average water levels and higher coefficients of variation for average water levels. Additionally, in lakes with a higher proportion of the direct catchment area relative to the total catchment area (CDA), higher amplitudes and coefficients of variation for maximum and average water levels are observed. Furthermore, higher amplitudes and coefficients of variation for maximum water levels occur in lakes located in catchments with a higher share of artificial areas (ArtA) and a lower share of forests (ForA). Meanwhile, higher amplitudes of water levels in lakes occur in lakes located in large catchments (CTA) with a higher density of river networks (CRD), a higher share of agricultural lands (AgrA), and a lower share of forests (ForA). Additionally, larger amplitudes of water levels were shown in lakes with a shorter water renewal time (ET). For this group of lakes, there were no relationships between the values of Sen’s slope estimators and the lake and catchment parameters.
