Wild how much the former East-West divide still shows up.
It’s like they say [“there is one map of Chicago”](https://www.chicagomag.com/news/there-is-one-map-of-chicago/) because no matter what data you overlay on a map of the city, it always breaks down on racial lines. Poverty, delinquent property taxes, homicides, functionality of municipal services, etc.
And to the east we can see the effects of communism…
And to the west, the depredations of the palatinate?
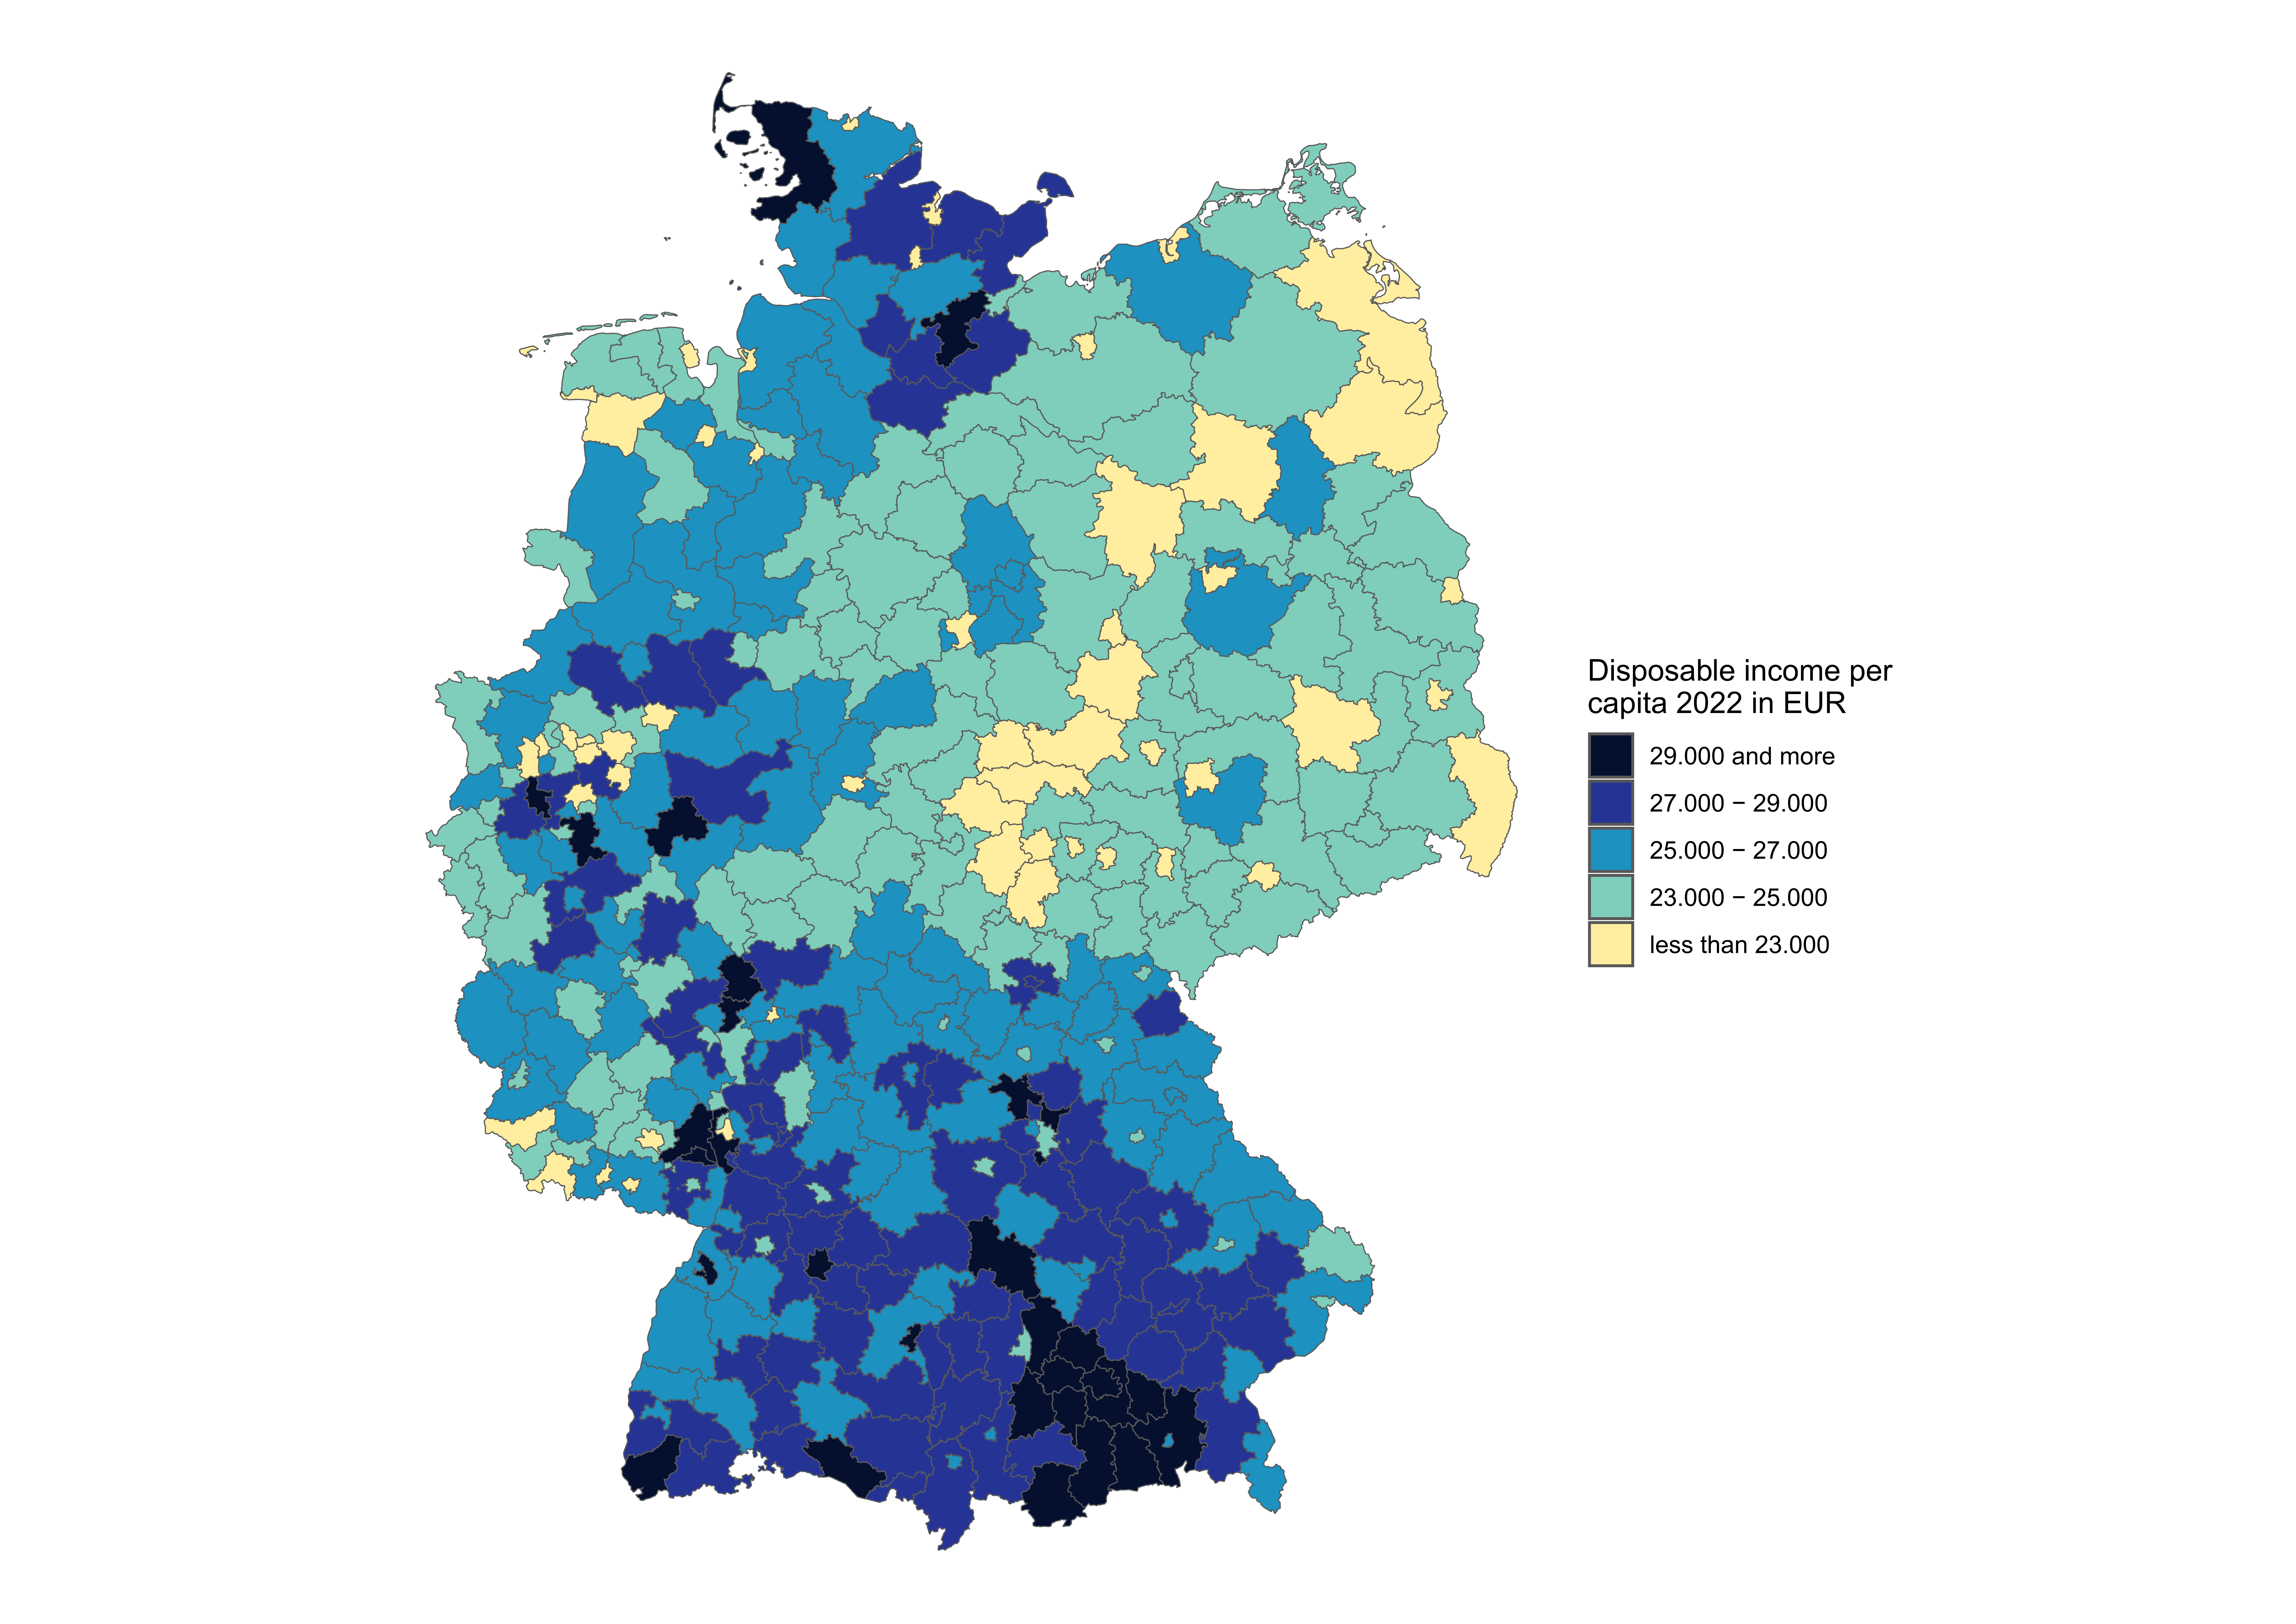
![[OC] Disposable income per capita in Germany by NUTS3 districts](https://www.europesays.com/wp-content/uploads/2025/01/oir4f1rsknbe1-1920x1024.png)
4 comments
Plot: OC created with R
Data source: Federal Statistical Office of Germany, https://www.statistikportal.de/de/vgrdl/ergebnisse-kreisebene/einkommen-kreise
Wild how much the former East-West divide still shows up.
It’s like they say [“there is one map of Chicago”](https://www.chicagomag.com/news/there-is-one-map-of-chicago/) because no matter what data you overlay on a map of the city, it always breaks down on racial lines. Poverty, delinquent property taxes, homicides, functionality of municipal services, etc.
And to the east we can see the effects of communism…
And to the west, the depredations of the palatinate?
What does “Disposable income” mean in this case?
Looks like Munich is the star here. I wonder why?
Comments are closed.