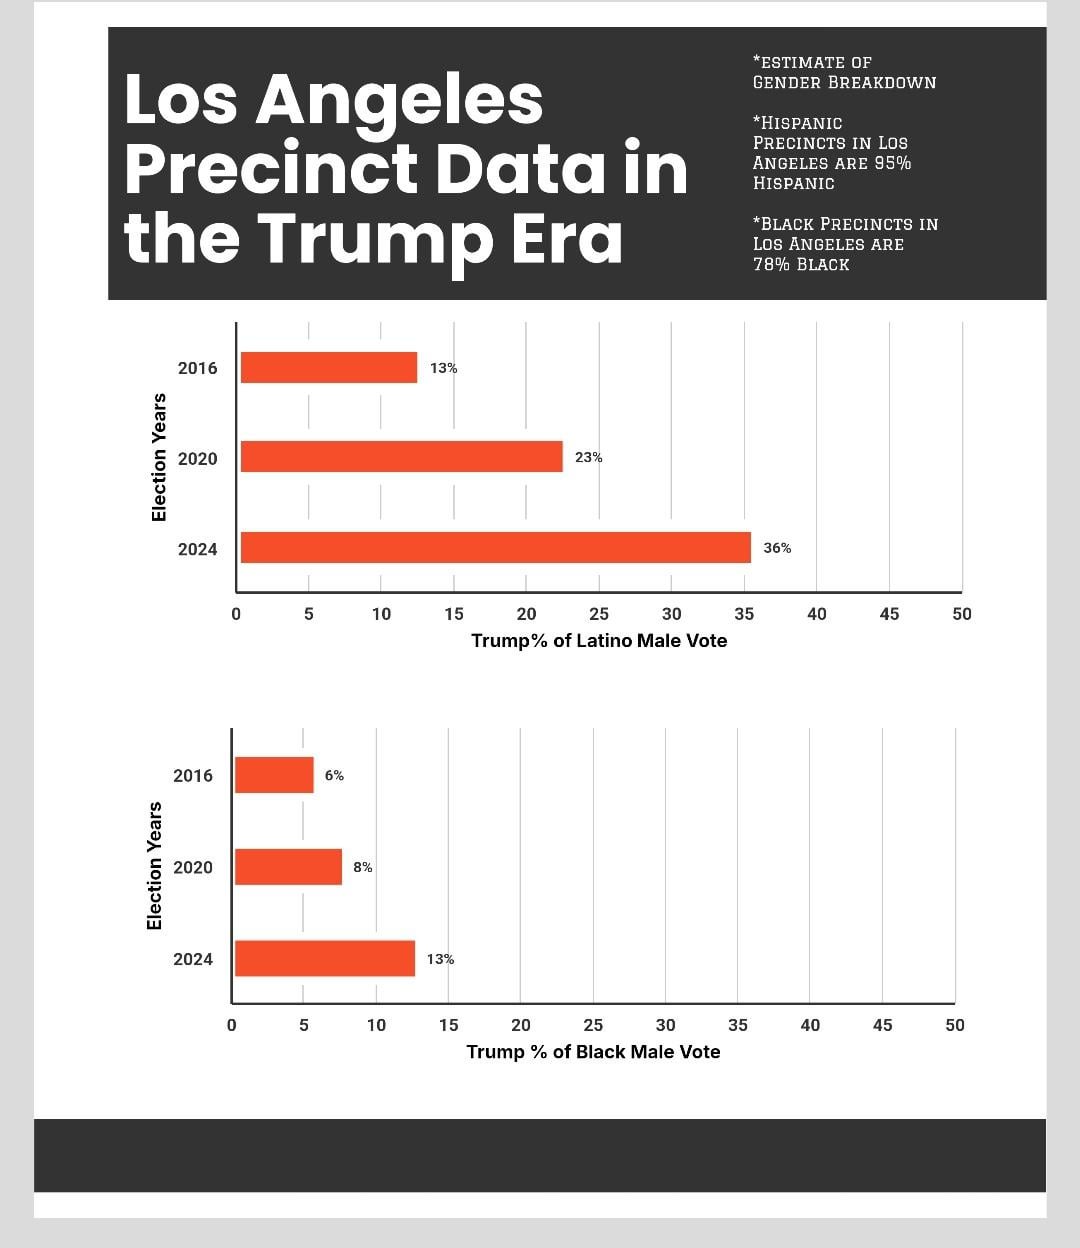
Latino Male support for Trump in Los Angeles has risen a whopping 23% since 2016.
In comparison Black Male support for Trump in Los Angeles has risen 7% since 2016.
Posted by Troy19999
![[OC] Los Angeles precinct data of Male POC every election](https://www.europesays.com/wp-content/uploads/2025/01/wjby7swu4oee1-1080x1024.jpeg)
Latino Male support for Trump in Los Angeles has risen a whopping 23% since 2016.
In comparison Black Male support for Trump in Los Angeles has risen 7% since 2016.
Posted by Troy19999
5 comments
People were complaining about the quality of my charts, so I hope this is bearable.
Chart was created with – https://venngage.com/blog/infographics-maker?utm_source=google&utm_medium=cpc&utm_campaign=&utm_content=&utm_term=&match=&campaignid=21735739398&adgroupid=&gad_source=1&gclid=Cj0KCQiAy8K8BhCZARIsAKJ8sfSzZ9ys2QQK4xlAQoc8Mu0LSyw204GGq2lf0GWtOSoNQ_lUyjEbcrMaAk8sEALw_wcB
Precinct data extracted with –
https://davesredistricting.org/
So if we marry the data, and correct for population size of african americans and latinos, the story is: in these communities Trump lost by 50 percentage point in his best showing (the most recent).
No, the rate of change between 13% and 36% is not 23%. That’s not how rates work.
Precinct? Is this about how minority police voted?
I’m always very surprised more black men do not vote Republican…they are often very conservative on many issues.
Comments are closed.