The data is interesting, but I really miss the labels on the axes
Suddenly realizing why my company just opened an office in Costa Rica
Working hours in India 🇮🇳 so extensive & the pay so less that the point would be way off the scatter graph
Friendly edit: “fewer” hours.
Too bad you didn’t add Singapore to this chart. At 2255 hrs/year, it’s right up there with Mexico.
Meanwhile, they are at about 82k (PPP) for average annual wages, almost identical to the US.
Quite the outlier here.
I thought Japan would be way further to the right. Don’t they have a workaholic culture ?
Why in annual work hours and not just hours per week? It makes this graph significantly harder to interpret
No one can concince me that italians work longer hours than japans
Is this only accounting for hourly workers? How do we get data for salaried workers?
Chile recently lowered their work hours too.
When I lived there I was working 45 hours a week (48 at work if you included the 30 minute lunch break), and made peanuts.
Would like to see this after “cost of living” is subtracted. Im an Australian/Canadian living in Canada. Both are top 10 in quality of life, but im sick of being stuck inside for 4 months of the year in both Countries. Where a good place to spend Dec-April?
Latvian salary is not correct. Mean salary is 1623 in 2024, with median salary 1293 eur. So actually it is around 20.3k usd, not 39k.
1650hours in Norway is the normal, idk why but its so low
Why we Americans always a fuckin outlier on these sorts of graphs.
I mean I know why but… What the fuck.
The Swedish one can not be correct..
30k is the median salary which id argue is still a bit ok high.
30 x 12 = 360k
360m is like 30k $
And that is w/o taxes..
OECD bullshit numbers, again! OECD clearly states that their numbers for work hours per year are not comparable. Here is the Salsa: [https://www.oecd.org/en/data/indicators/hours-worked.html](https://www.oecd.org/en/data/indicators/hours-worked.html)
“The data are intended for comparisons of trends over time; they are unsuitable for comparisons of the level of average annual hours of work for a given year, because of differences in sources and methods of calculation.”
I’d argue with mandated overtime, less vacation time, we americans are closer to the 2k mark than 1.8
Average wage is not a very meaningful metric
As a german. Workmoral is low these days xd.
I had teams of Colombian engineers and they get 2 Mondays off a month. Either our legal and country manager were scamming us or these figures may be a bit skewed.
Would like to see this cross compared with cost of living.
The data you posted doesn’t support that conclusion. Just look at the US.
the average annual wage is $80k a year??? i’m so fucked.
Richest countries work less
This looks to be a very weak correlation based on questionable data TBH
Damn. I work more hours and get paid less than the average American
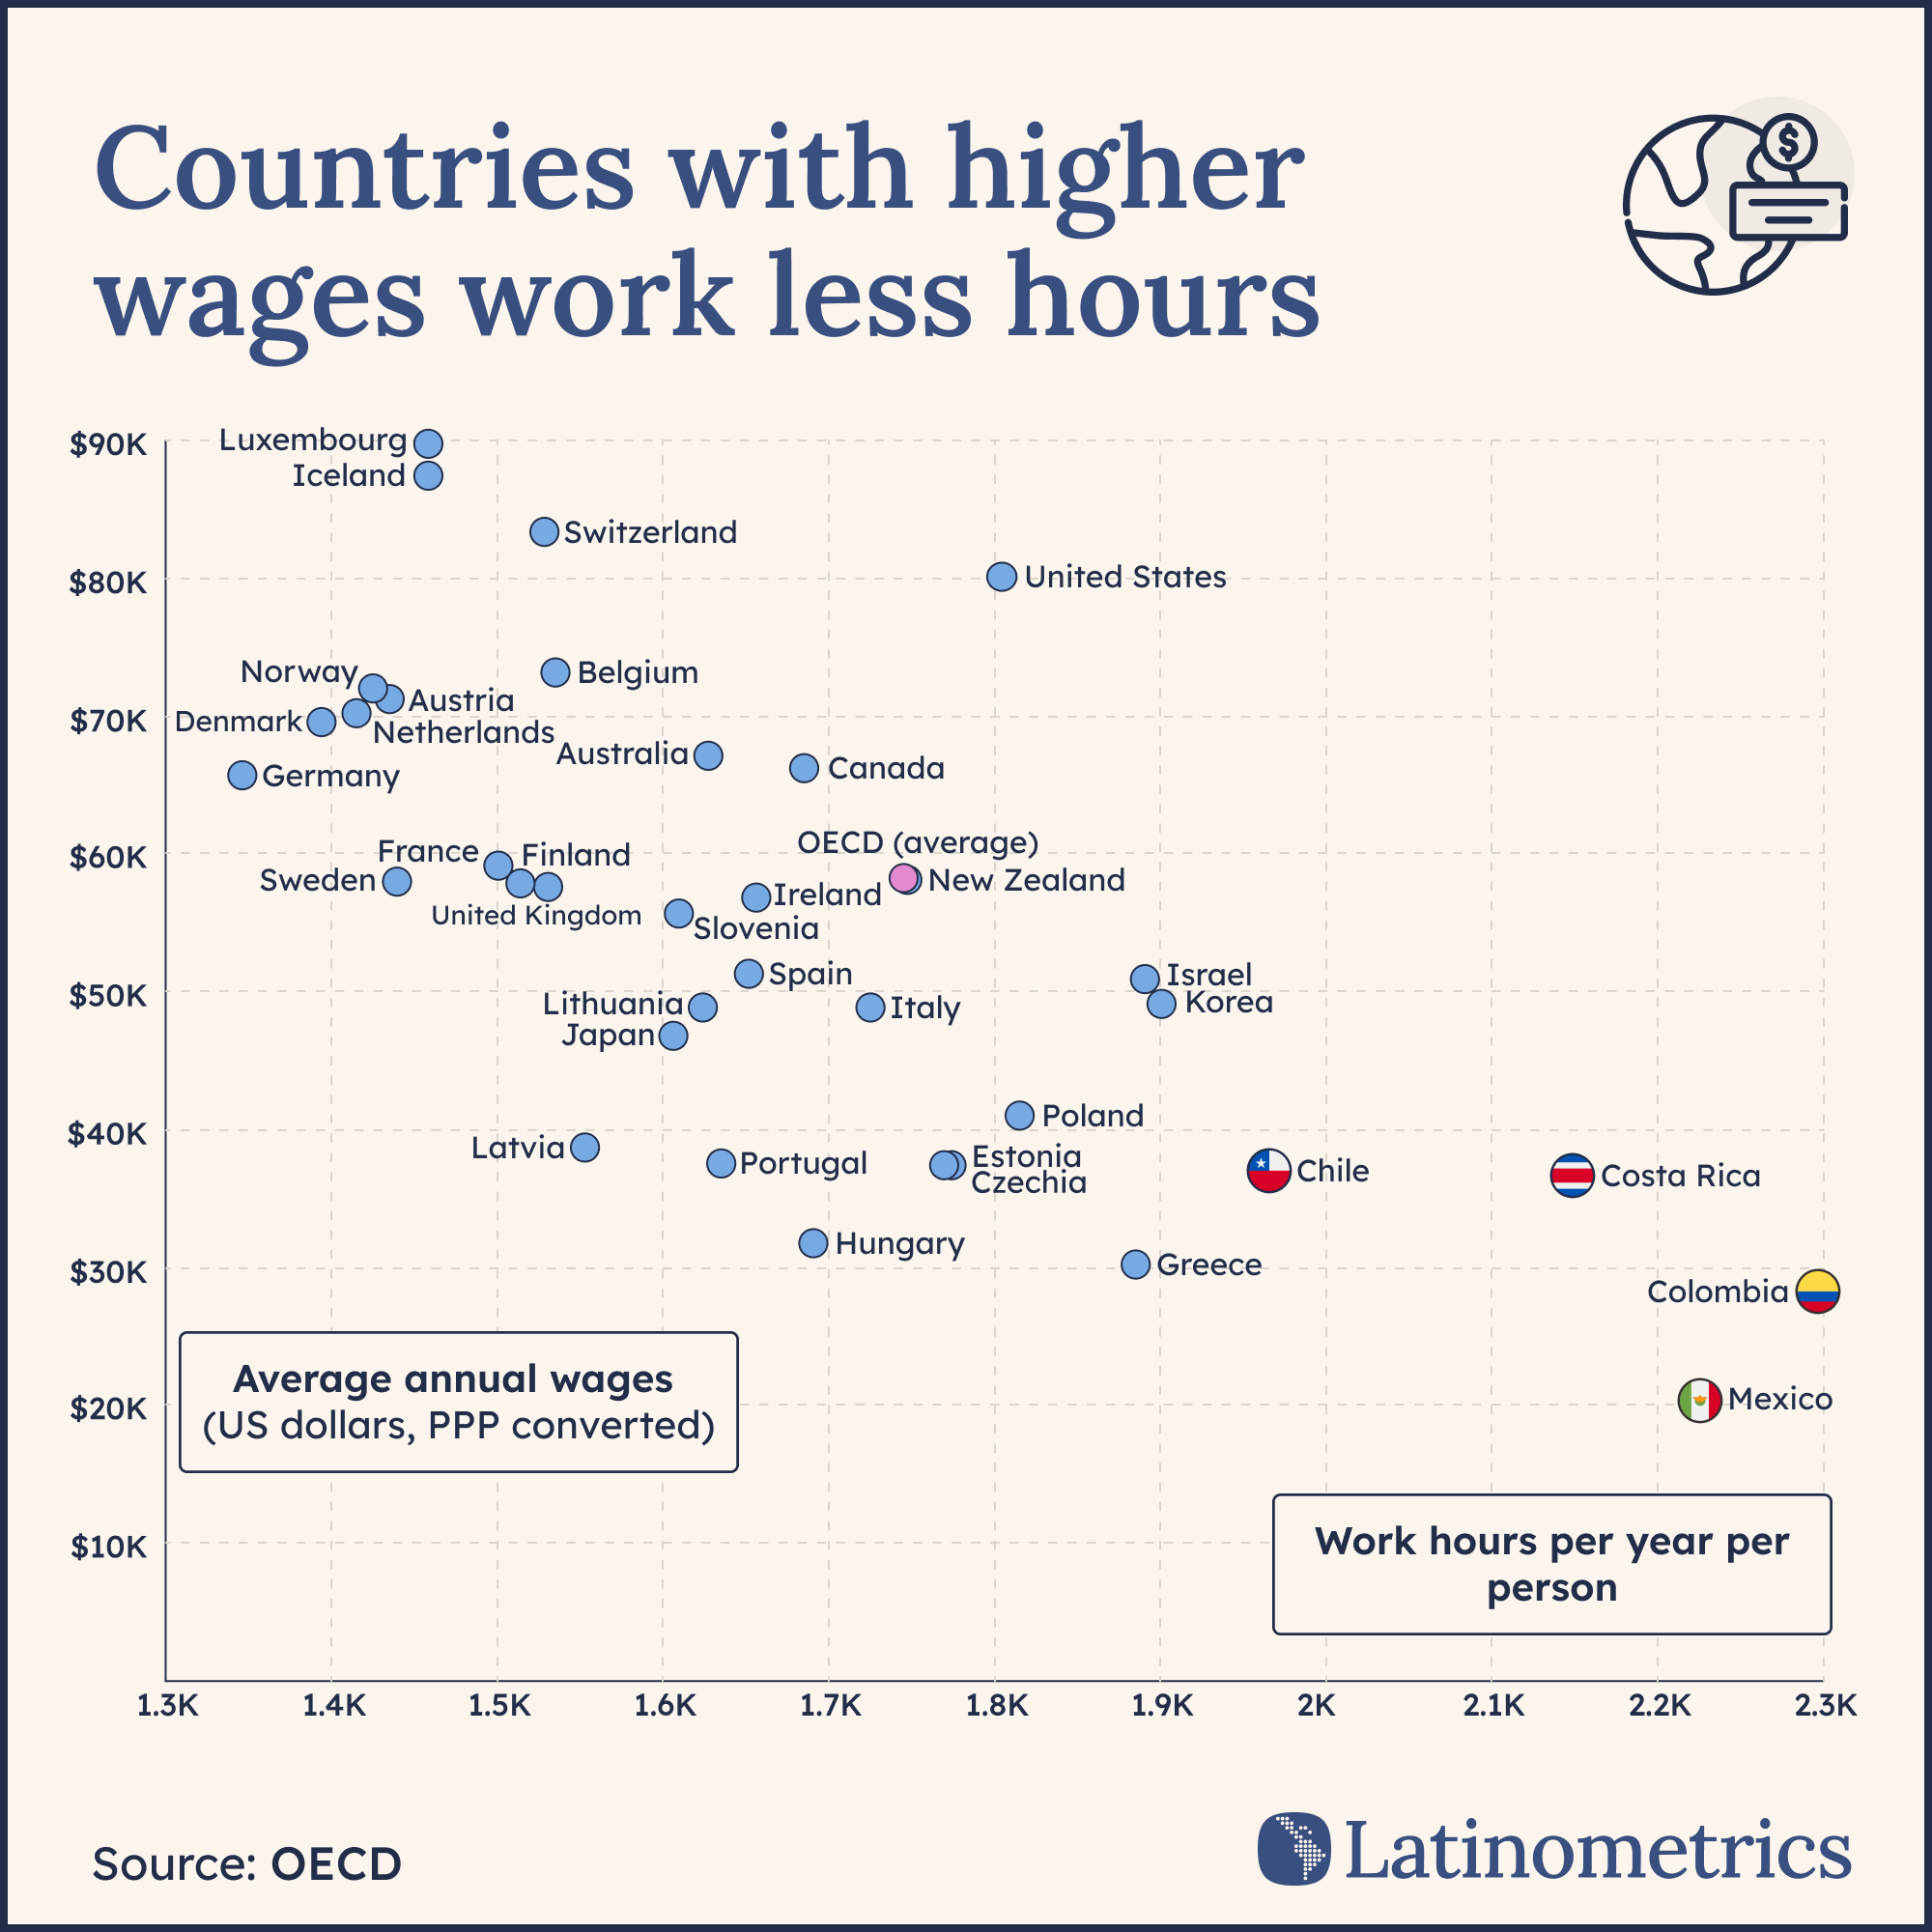
![[OC] Countries with higher wages work less hours](https://www.europesays.com/wp-content/uploads/2025/01/vsj9vpn1asee1-1920x1024.png)
28 comments
Yet another thing Iceland has going for it that makes me want to move there!
🇲🇽 Mexican employees on average work more than their counterparts in almost every other OECD country.
Does this hard work translate to higher wages? No it does not.
Join our newsletter to find out more and get access to all our data stories: [latinometrics.com/join](http://latinometrics.com/join)
Sources: [wages](https://data-explorer.oecd.org/vis?tm=wages&pg=0&snb=121&vw=tl&df%5Bds%5D=dsDisseminateFinalDMZ&df%5Bid%5D=DSD_EARNINGS%40AV_AN_WAGE&df%5Bag%5D=OECD.ELS.SAE&df%5Bvs%5D=1.0&dq=CHL%2BCRI%2BMEX%2BCOL..USD_PPP..Q..&pd=2000%2C&to%5BTIME_PERIOD%5D=false), [work hours](https://www.oecd.org/en/data/indicators/hours-worked.html)
Tools: Rawgraphs & Figma
The data is interesting, but I really miss the labels on the axes
Suddenly realizing why my company just opened an office in Costa Rica
Working hours in India 🇮🇳 so extensive & the pay so less that the point would be way off the scatter graph
Friendly edit: “fewer” hours.
Too bad you didn’t add Singapore to this chart. At 2255 hrs/year, it’s right up there with Mexico.
Meanwhile, they are at about 82k (PPP) for average annual wages, almost identical to the US.
Quite the outlier here.
I thought Japan would be way further to the right. Don’t they have a workaholic culture ?
Why in annual work hours and not just hours per week? It makes this graph significantly harder to interpret
No one can concince me that italians work longer hours than japans
Is this only accounting for hourly workers? How do we get data for salaried workers?
Chile recently lowered their work hours too.
When I lived there I was working 45 hours a week (48 at work if you included the 30 minute lunch break), and made peanuts.
Would like to see this after “cost of living” is subtracted. Im an Australian/Canadian living in Canada. Both are top 10 in quality of life, but im sick of being stuck inside for 4 months of the year in both Countries. Where a good place to spend Dec-April?
Latvian salary is not correct. Mean salary is 1623 in 2024, with median salary 1293 eur. So actually it is around 20.3k usd, not 39k.
1650hours in Norway is the normal, idk why but its so low
Why we Americans always a fuckin outlier on these sorts of graphs.
I mean I know why but… What the fuck.
The Swedish one can not be correct..
30k is the median salary which id argue is still a bit ok high.
30 x 12 = 360k
360m is like 30k $
And that is w/o taxes..
OECD bullshit numbers, again! OECD clearly states that their numbers for work hours per year are not comparable. Here is the Salsa: [https://www.oecd.org/en/data/indicators/hours-worked.html](https://www.oecd.org/en/data/indicators/hours-worked.html)
“The data are intended for comparisons of trends over time; they are unsuitable for comparisons of the level of average annual hours of work for a given year, because of differences in sources and methods of calculation.”
As an example Germany currently has, as of 2023 34,4 h per week and therefore 1788,8 h per year on average
Salsa: [https://www.destatis.de/DE/Themen/Arbeit/Arbeitsmarkt/Qualitaet-Arbeit/Dimension-3/woechentliche-arbeitszeitl.html](https://www.destatis.de/DE/Themen/Arbeit/Arbeitsmarkt/Qualitaet-Arbeit/Dimension-3/woechentliche-arbeitszeitl.html)
I’d argue with mandated overtime, less vacation time, we americans are closer to the 2k mark than 1.8
Average wage is not a very meaningful metric
As a german. Workmoral is low these days xd.
I had teams of Colombian engineers and they get 2 Mondays off a month. Either our legal and country manager were scamming us or these figures may be a bit skewed.
Would like to see this cross compared with cost of living.
The data you posted doesn’t support that conclusion. Just look at the US.
the average annual wage is $80k a year??? i’m so fucked.
Richest countries work less
This looks to be a very weak correlation based on questionable data TBH
Damn. I work more hours and get paid less than the average American
Comments are closed.