
Jan 24, 2025
France Headphone Imports
Headphone imports into France declined markedly to 21M units in 2024, reducing by -16.7% compared with the previous year’s figure. In general, imports recorded a abrupt contraction. The pace of growth was the most pronounced in 2018 when imports increased by 290% against the previous year. Over the period under review, imports hit record highs at 106M units in 2019; however, from 2020 to 2024, imports failed to regain momentum.
In value terms, headphone imports fell significantly to $590M (IndexBox estimates) in 2024. Over the period under review, imports, however, posted strong growth. The pace of growth appeared the most rapid in 2018 with an increase of 26%. Over the period under review, imports hit record highs at $760M in 2021; however, from 2022 to 2024, imports stood at a somewhat lower figure.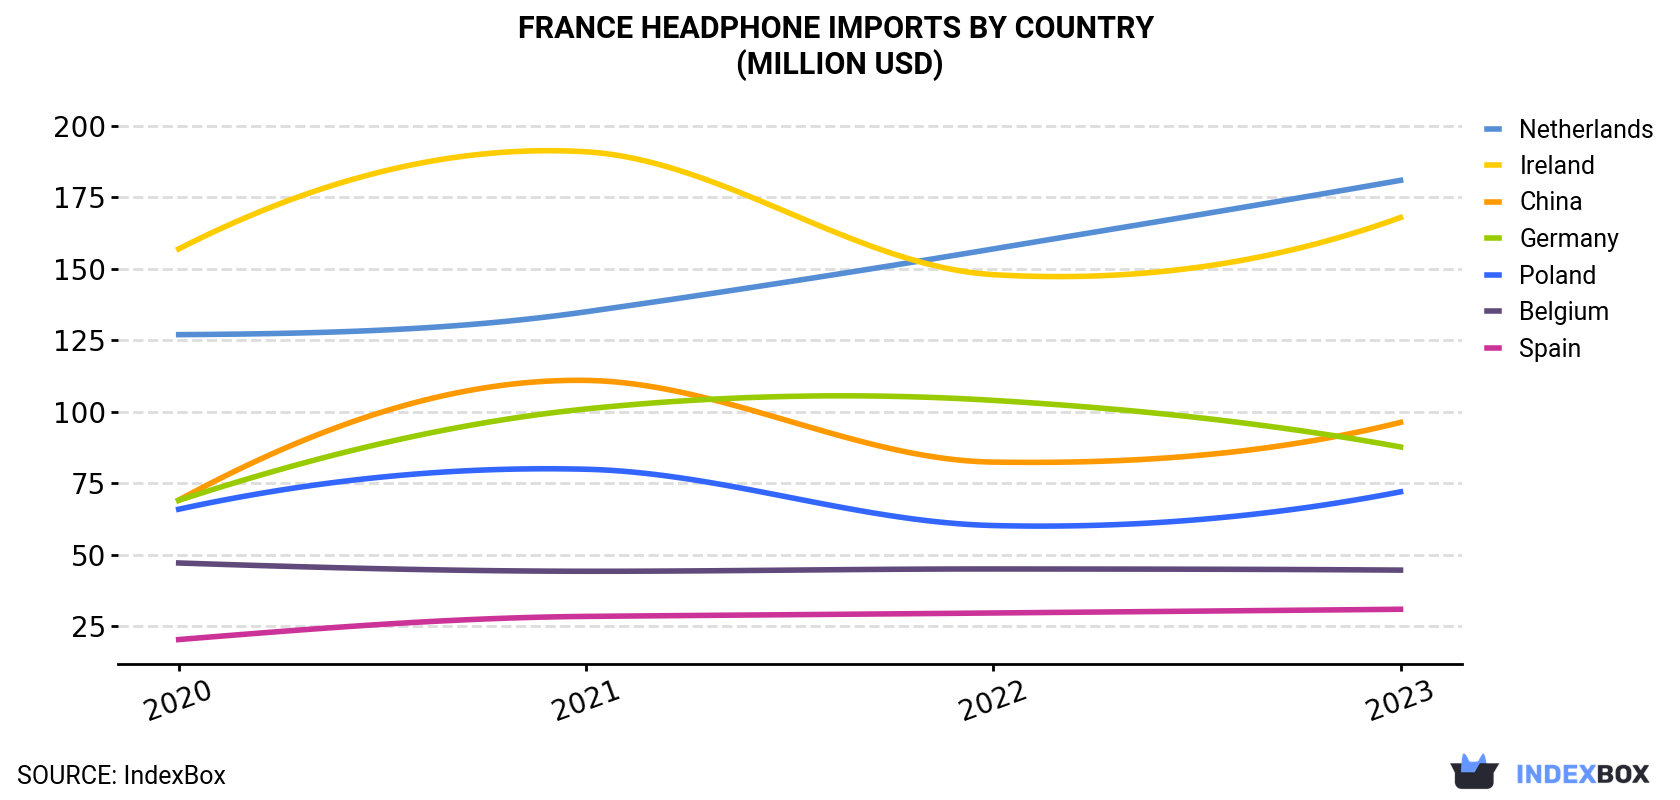
Imports by Country
the Netherlands (7.8M units), China (6.7M units) and Poland (2M units) were the main suppliers of headphone imports to France, together accounting for 66% of total imports.
From 2020 to 2023, the biggest increases were recorded for Poland (with a CAGR of +33.7%), while purchases for the other leaders experienced more modest paces of growth.
In value terms, the Netherlands ($181M), Ireland ($168M) and China ($96M) were the largest headphone suppliers to France, with a combined 59% share of total imports. Germany, Poland, Belgium and Spain lagged somewhat behind, together accounting for a further 31%.
Spain, with a CAGR of +15.0%, saw the highest rates of growth with regard to the value of imports, in terms of the main suppliers over the period under review, while purchases for the other leaders experienced more modest paces of growth.
Import Prices by Country
In 2023, the headphone price amounted to $30 per unit (CIF, France), rising by 15% against the previous year. In general, the import price saw a relatively flat trend pattern. As a result, import price reached the peak level and is likely to continue growth in the immediate term.
Prices varied noticeably by country of origin: amid the top importers, the country with the highest price was Ireland ($102 per unit), while the price for China ($14 per unit) was amongst the lowest.
From 2020 to 2023, the most notable rate of growth in terms of prices was attained by China (+12.4%), while the prices for the other major suppliers experienced more modest paces of growth.
Source: IndexBox Market Intelligence Platform
This report provides an in-depth analysis of the headphone market in France. Within it, you will discover the latest data on market trends and opportunities by country, consumption, production and price developments, as well as the global trade (imports and exports). The forecast exhibits the market prospects through 2030.
Product coverage:Prodcom 26404270 – Headphones and earphones, even with microphone, and sets consisting of microphone and one or more loudspeakers (excluding airmenCountry coverage:Data coverage:Market volume and valuePer Capita consumptionForecast of the market dynamics in the medium termTrade (exports and imports) in FranceExport and import pricesMarket trends, drivers and restraintsKey market players and their profilesReasons to buy this report:Take advantage of the latest dataFind deeper insights into current market developmentsDiscover vital success factors affecting the market
This report is designed for manufacturers, distributors, importers, and wholesalers, as well as for investors, consultants and advisors.
In this report, you can find information that helps you to make informed decisions on the following issues:
How to diversify your business and benefit from new market opportunitiesHow to load your idle production capacityHow to boost your sales on overseas marketsHow to increase your profit marginsHow to make your supply chain more sustainableHow to reduce your production and supply chain costsHow to outsource production to other countriesHow to prepare your business for global expansion
While doing this research, we combine the accumulated expertise of our analysts and the capabilities of artificial intelligence. The AI-based platform, developed by our data scientists, constitutes the key working tool for business analysts, empowering them to discover deep insights and ideas from the marketing data.
1. INTRODUCTION
Making Data-Driven Decisions to Grow Your Business
REPORT DESCRIPTION
RESEARCH METHODOLOGY AND AI PLATFORM
DATA-DRIVEN DECISIONS FOR YOUR BUSINESS
GLOSSARY AND SPECIFIC TERMS
2. EXECUTIVE SUMMARY
A Quick Overview of Market Performance
KEY FINDINGS
MARKET TRENDS
This Chapter is Available Only for the Professional Edition
PRO
3. MARKET OVERVIEW
Understanding the Current State of The Market and Its Prospects
MARKET SIZE
MARKET STRUCTURE
TRADE BALANCE
PER CAPITA CONSUMPTION
MARKET FORECAST TO 2030
4. MOST PROMISING PRODUCT
Finding New Products to Diversify Your Business
This Chapter is Available Only for the Professional Edition
PRO
TOP PRODUCTS TO DIVERSIFY YOUR BUSINESS
BEST-SELLING PRODUCTS
MOST CONSUMED PRODUCT
MOST TRADED PRODUCT
MOST PROFITABLE PRODUCT FOR EXPORT
5. MOST PROMISING SUPPLYING COUNTRIES
Choosing the Best Countries to Establish Your Sustainable Supply Chain
This Chapter is Available Only for the Professional Edition
PRO
TOP COUNTRIES TO SOURCE YOUR PRODUCT
TOP PRODUCING COUNTRIES
TOP EXPORTING COUNTRIES
LOW-COST EXPORTING COUNTRIES
6. MOST PROMISING OVERSEAS MARKETS
Choosing the Best Countries to Boost Your Exports
This Chapter is Available Only for the Professional Edition
PRO
TOP OVERSEAS MARKETS FOR EXPORTING YOUR PRODUCT
TOP CONSUMING MARKETS
UNSATURATED MARKETS
TOP IMPORTING MARKETS
MOST PROFITABLE MARKETS
7. PRODUCTION
The Latest Trends and Insights into The Industry
PRODUCTION VOLUME AND VALUE
8. IMPORTS
The Largest Import Supplying Countries
IMPORTS FROM 2012–2024
IMPORTS BY COUNTRY
IMPORT PRICES BY COUNTRY
9. EXPORTS
The Largest Destinations for Exports
EXPORTS FROM 2012–2024
EXPORTS BY COUNTRY
EXPORT PRICES BY COUNTRY
10. PROFILES OF MAJOR PRODUCERS
The Largest Producers on The Market and Their Profiles
This Chapter is Available Only for the Professional Edition
PRO
LIST OF TABLES
Key Findings In 2024
Market Volume, In Physical Terms, 2012–2024
Market Value, 2012–2024
Per Capita Consumption In 2012-2024
Imports, In Physical Terms, By Country, 2012–2024
Imports, In Value Terms, By Country, 2012–2024
Import Prices, By Country Of Origin, 2012–2024
Exports, In Physical Terms, By Country, 2012–2024
Exports, In Value Terms, By Country, 2012–2024
Export Prices, By Country Of Destination, 2012–2024
LIST OF FIGURES
Market Volume, In Physical Terms, 2012–2024
Market Value, 2012–2024
Market Structure – Domestic Supply vs. Imports, In Physical Terms, 2012-2024
Market Structure – Domestic Supply vs. Imports, In Value Terms, 2012-2024
Trade Balance, In Physical Terms, 2012-2024
Trade Balance, In Value Terms, 2012-2024
Per Capita Consumption, 2012-2024
Market Volume Forecast to 2030
Market Value Forecast to 2030
Products: Market Size And Growth, By Type
Products: Average Per Capita Consumption, By Type
Products: Exports And Growth, By Type
Products: Export Prices And Growth, By Type
Production Volume And Growth
Exports And Growth
Export Prices And Growth
Market Size And Growth
Per Capita Consumption
Imports And Growth
Import Prices
Production, In Physical Terms, 2012–2024
Production, In Value Terms, 2012–2024
Imports, In Physical Terms, 2012–2024
Imports, In Value Terms, 2012–2024
Imports, In Physical Terms, By Country, 2024
Imports, In Physical Terms, By Country, 2012–2024
Imports, In Value Terms, By Country, 2012–2024
Import Prices, By Country Of Origin, 2012–2024
Exports, In Physical Terms, 2012–2024
Exports, In Value Terms, 2012–2024
Exports, In Physical Terms, By Country, 2024
Exports, In Physical Terms, By Country, 2012–2024
Exports, In Value Terms, By Country, 2012–2024
Export Prices, By Country Of Destination, 2012–2024