The animal study was approved by LANUV, Recklinghausen, Germany. The study was conducted in accordance with the local legislation and institutional requirements.
Animal studies
Six- to eight-week-old female C57BL/6J mice were used throughout the experiments. We used female animals for this study, as UTI mostly affects women. Animals were purchased from Charles River Laboratories and maintained under specific-pathogen-free conditions in the central animal facility at the University Hospital Essen. The mice were kept at 20–24 °C and 45–65% humidity in a 12-h dark-light cycle. They were housed in stable social groups and provided with species-appropriate food and water, suitable bedding and nesting material as well as a shelter for rodents. The local review board (Bezirksregierung Köln, Landesamt für Natur, Umwelt und Verbraucherschutz NRW in Recklinghausen, Germany) approved the animal experiments.
Urinary tract infection model
UPEC strain 536 (O6:K15:H31) was cultured for 3 h at 37 °C in LB medium. The bacteria were harvested by centrifugation at 1500 × g for 20 min and then the OD(600) was measured. The bacteria were resuspended at a concentration of 1010 bacteria/mL in sterile PBS. A mixture of ketamine and xylazine 80/10 mg/kg body weight in 150 μl PBS was injected intraperitoneally to anesthetise the mice. The infection of the animals was induced by transurethral inoculation of 5 × 10⁸ UPEC in 0.05 mL PBS using a soft polyethylene catheter.
IFM
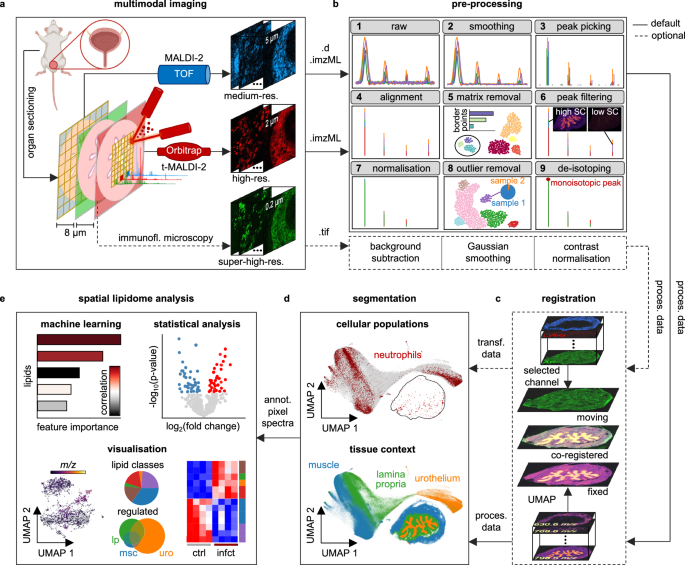
UPEC-infected urinary bladders (n = 4) were fixed overnight in PLP buffer [pH 7.4, 0.05 M phosphate buffer containing 0.1 M L-lysine, 2 mg/mL sodium periodate and paraformaldehyde with a final w/v concentration of 1%], equilibrated in 30% sucrose for 24 h and stored at −80 °C. Bladder tissue was cut into 8 µm thick sections at −20 °C using a cryostat. Unspecific binding was blocked by incubation of the sections with PBS containing 1% BSA and 0.05% Triton X-100 for 1 h. Bladder sections were mounted into MACSwell sample carriers, blocked using a blocking buffer containing 10% BSA and 2% goat serum for 1 h at RT before nuclei were counterstained using DAPI-staining solution (Miltenyi Biotec) according to the manufacturer’s recommendations before being placed into a MACSima imaging system. Sections were then incubated with directly conjugated antibodies against Ly6G (1A8, Miltenyi Biotec, PE,1:50), EpCAM (REA977, Miltenyi Biotec, APC,1:50), SMA (REAL650, Miltenyi Biotec, FITC, 1:300) and CXCR2 (SA044G4, BioLegend, PE, 1:50). Acquired pictures were stitched using the pre-processing pipeline in MACS iQ View Analysis Software (Miltenyi Biotec) for downstream analysis.
MALDI MSI
Unfixed tissue sections of infected and control bladders (n = 10, 5 infected and 5 control) were thawed under a gentle stream of dry N2 gas. For t-MALDI measurements, the tissue sections were washed with 250 µL of a 150 mM ammonium acetate solution to remove alkali metal salts and dried again under a gentle stream of dry N2 gas. 2,5-DHAP matrix was applied onto the tissue section by sublimation in a home-build sublimation device described earlier by Bien et al.59. 1.5 mL of a 20 mg/mL solution of 2,5-DHAP in acetone was filled into the matrix reservoir and heated to about 120 °C which caused the acetone to evaporate. The sample was mounted to the cold side of the sublimation device and kept at around 4 °C at an approximate vertical distance of 6 cm above the matrix reservoir. The sublimation device was evacuated to a pressure of about 5 × 10⁻³ mbar and the sublimation was conducted for 10 min. The samples were measured immediately after sublimation.
All MALDI MSI measurements were carried out in positive-ion mode. MALDI-2 MSI data with a pixel size of 5 µm was acquired with a timsTOF fleX MALDI-2 (QTOF) instrument with microGRID extension (Bruker Daltonics, Bremen, Germany). The MALDI and postionisation laser were operated with a pulse repetition rate of 1 kHz and a delay of 10 µs. The ablation laser power was set to 80% with 25 shots per pixel. The ion detection range was set to m/z 300–1500.
The TIMS separated MS/MS measurement was acquired with a pixel size of 50 µm with 250 laser shots, a 1/k0 range from 1.4 to 1.8 with N2 as collision gas, a ramp time of 250 ms, an isolation window of 1 Da and 30 eV collision energy.
The t-MALDI-2 MSI data with a pixel size of 2 µm was acquired with a setup which has been described in detail previously14,60. For this, a Q Exactive Plus Orbitrap mass spectrometer (Thermo Fisher Scientific, Bremen, Germany) equipped with a modified dual-ion funnel source (Spectroglyph, Kennewick, WA, USA), which enabled transmission-mode illumination and MALDI-2 postionisation, was used. Both lasers were operated with a pulse repetition rate of 100 Hz and a delay of 10 µs. A mass resolving power of 70,000 (defined for m/z 200) with a fixed injection time of 250 ms and an ion detection range of m/z 350–1500 were used. MALDI-DDA-MSI was used to confirm some of the tentatively annotated lipids with on-tissue MS/MS. For this a similar approach to the one used by Ellis et al.61. was chosen, which alternates full-scan and MS/MS pixel. For this front side illumination was used with a step size in x- and y-direction of 10 µm and 20 µm, respectively. For the full-scan pixels, an ion detection range of m/z 550–1500 was used. For DDA MS/MS measurements an isolation window of 1 Da and a fixed first mass of m/z 100 with an NCE of 25 were used. The exclusion time was set to 30 s with isotope exclusion enabled. The mass resolving power for both full-scan and MS/MS was set to 70,000 and the injection time was fixed at 250 ms. The MALDI-DDA-MSI data were analysed using Lipostar MSI (vs. 1.3, Molecular Horizon, Bettona, Italy) and annotated using the Lipid Maps Structure Database (https://www.lipidmaps.org/databases/lmsd). The import and annotation settings for Lipostar MSI are shown in Supplementary Fig. 8.
Isolation of bone marrow-derived neutrophils
BM-derived neutrophils were obtained using a mouse Neutrophil Isolation Kit (Miltenyi Biotec, 130-097-658) following the manufacturer’s instructions. In brief, the BM of a femur was flushed, and erythrocytes lysed using RBC Lysis Buffer (BioLegend, 420302; 1 min on ice). Cells were then sequentially incubated with Neutrophil Biotin-Antibody Cocktail and Anti-Biotin Microbeads before neutrophils were isolated using a negative selection on a magnetic column. The isolated neutrophils were then centrifuged onto slides using a cytospin centrifuge, fixed for 5 min using 4% formaldehyde, washed two times with 500 µL PBS followed by two washes with 500 µL of a 150 mM ammonium acetate solution to remove the PBS. For MALDI MSI matrix application was carried out as described above and the cells were measured with 50 µm pixel size on the timsTOF fleX MALDI-2 (QTOF).
LC-MS/MS
Lipids were extracted using methyl tert-butyl ether (MTBE) extraction and analysed with liquid chromatography-tandem mass spectrometry (LC-MS/MS) as reported earlier62. In brief, snap-frozen urinary bladder tissues were homogenised in ice-cold IPA:H2O (1:1 v/v; 150 μL), spiked with 10 μL of SPLASH lipid standard mix, and then subjected to liquid–liquid extraction using MeOH, MTBE and water solvent mixture with a final ratio of 1:3:1 (v/v/v). The upper organic phase was collected, dried out under a nitrogen gas stream, and reconstituted in 100 μL of ACN:IPA:H2O buffer (65:30:5 v/v/v). Resuspended lipid extracts (10 μL) were loaded on a reversed-phase ACQUITY UPLC HSS T3 (1.8 μm, 100 × 2.1 mm, Waters Corporation) column and separated using a Vanquish Duo UHPLC-system (Thermo Fisher Scientific, Waltham, MA, USA) with a flow rate of 250 μL/min. The mobile phases consisted of eluent A (H2O:ACN, 40:60 v/v) and eluent B (IPA:ACN, 90:10 v/v) both with 10 mM ammonium formate and 0.1% formic acid. All the datasets were acquired independently in negative- and positive-ion mode in a data-dependent manner using Orbitrap Fusion Lumos Tribrid Mass Spectrometer (Thermo Fisher Scientific, Waltham, MA, USA) equipped with a heated electrospray ionisation source. Lipids were annotated and validated with lipid class and molecular-species specific diagnostic fragment ions63.
MSI data pre-processing
MALDI MSI data were pre-processed by custom-designed Python scripts which were automated in a Snakemake64 pipeline. The pipeline takes raw timsTOF files as input, processes all files in parallel and outputs the processed data in imzML format along with various quality control visualisations for each step. All parameters used within this study are listed in Supplementary Table 1. In the first step, Savitzky–Golay smoothing65 was used to reduce spectral random noise. Centroid spectra were extracted by using the find_peaks function from the SciPy signal processing library with default parameters. Peaks with a SNR of at least three were selected. The noise was calculated by the median absolute deviation. To eliminate mass drifts, the pipeline contains an alignment procedure using a kernel-based clustering approach adapted from pyBASIS20. Here peaks which were present in at least 3% of all pixels across all samples formed the common m/z vector to which the peaks were aligned by nearest-neighbour mapping. Then off-tissue/matrix pixels were identified and removed for each dataset (Supplementary Fig. 2). To identify matrix pixels, data of each sample were first reduced to two dimensions by using UMAP followed by HDBSCAN clustering. The cluster which was connected to most pixels of the border of the measured area was considered the matrix cluster. Clusters with a Spearman correlation above 0.7 to the matrix cluster were combined to an extended matrix cluster. In the third step, the binary image of the extended matrix cluster was post-processed by removing isolated objects of up to 5 pixels followed by a binary closing operation using a 5 × 5 pixel square structuring element for the dilation and a 2 × 2 pixel square structuring element for the erosion. For the post-processing, the scikit-image and SciPy libraries were used. After matrix removal, the spatial coherence44 was calculated for each ion which measures its informativeness. Ions with low spatial coherence were removed. Then the data were normalised by median-fold-change normalisation to account for intra-sample and inter-sample variation. To indicate spectra variations among the samples, a UMAP-based outlier detection method was applied (Supplementary Fig. 3). Here the data of all samples were first reduced to two dimensions by using UMAP followed by HDBSCAN clustering. Then SSCs were identified. SSCs are clusters in which most pixels originate from one sample. Finally, samples in which most pixels were SSC pixels were considered sample outliers. De-isotoping was performed as the last step. In an iterative approach, isotopes were identified based on their theoretical m/z value within a predefined tolerance range and their theoretical intensity pattern.
Lipid annotation
In the first step, a list of tentative annotations of m/z values was made by using the bulk structure search provided on the LipidMaps website (www.lipidmaps.org). We searched for matches between all expected lipid classes (fatty acids/esters [FA], ceramides [Cer], sphingomyelins [SM], hexosyl ceramides [HexCer], triglycerols [TG], diglycerols [DG], glycerophosphocholines [PC], glycerophosphates [PA], glycerophosphoserines [PS], glycerophosphoethanolamines [PE], glycerophosphoglycerols [PG], sterols [ST]) and [M + H]+, [M−H2O + H]+, [M + Na]+ and [M + K]+ precursor ions with a mass tolerance of ±0.01 m/z. This list was then manually curated considering the biological context and expanded with the annotations gained from MALDI-DDA-MSI as well as other on-tissue MALDI MS/MS experiments. In addition, some lipids were validated by LC-MS/MS, as described in LC-MS/MS validation strategy for lipid annotations66. If no further information from MS/MS was gained, the annotation is only based on the lipid species level, which means in the context of ether lipids, that 1-O-alkyl lipids with at least one double bond could also be interpreted as 1-O-alkenyl ethers, as described in lipid nomenclature guidelines67.
Data analysis, statistics and visualisation
Tissue segmentation was performed on the full m/z spectrum of all control and infected urinary bladder sections by UMAP (n_neighbors = 10, min_dist = 0.0, dist_metric = ‘cosine’) followed by HDBSCAN clustering (min_samples = 50, min_cluster_size = 10,000). The clusters were manually merged into super-clusters which represent the main tissue context (urothelium, lamina propria and muscle). Then mean spectra of the pixel clusters were extracted and statistically analysed by two-sided statistical tests using the Python package SciPy. The standard t-test was used for normally distributed populations with equal variances and the Welch’s t-test for normally distributed populations with unequal variances. Non-normally distributed populations were statistically analysed by the Wilcoxon rank-sum test. The Shapiro–Wilk test and Levene test were used to test for normal distribution and equal variances. The ratio between the means of two populations (here control and infected) was determined as log2(fold change). A full statistical summary (means, standard deviations, test statistics, degrees of freedom, p values and fold changes) is provided in the source data file.
For the lipidomic analysis of neutrophils, we reduced the m/z spectrum by filtering out m/z values for which no lipid in the database could be matched based on our m/z tolerance, as well as tissue-specific m/z values with a Pearson’s correlation (SciPy Python package) above 0.5 to one of the tissue regions extracted from the previous tissue segmentation (urothelium, lamina propria, muscle). To differentiate between Ly6G+ and Ly6G− pixels, we segmented the registered Ly6G images using the Python package Scikit-image. First images were Gaussian smoothed with sigma = 1 followed by Otsu thresholding. Finally, small objects (below 10 pixels size) were removed. Unsupervised clustering of Ly6G+ pixels was performed by UMAP (n_neighbors = 3, min_dist = 0.0, dist_metric = ‘cosine’) followed by HDBSCAN clustering (min_samples = 30, min_cluster_size = 500).
Important lipids for the ROIs (here tissue regions and neutrophils) were extracted by using Extreme Gradient Boosting (XGBoost)-based classification with class weights, Pearson’s correlation and SHAP values. Therefore, the Python packages XGBoost, SciPy and SHAP were used. Class weights were calculated by #samples / (#classes * #occurences) using the Python package scikit-learn.
The Python packages Pandas, Seaborn, Matplotlib and matplotlib-venn were used to generate all visualisations (volcano plots, scatterplots, pie charts, Venn diagrams, segmented images and bar plots).
Microscopy data pre-processing
Images were pre-processed by rolling-ball background subtraction, Gaussian smoothing with sigma = 3 followed by percentile stretching using the Python library scikit-image.
Registration of microscopy and MALDI MSI
Initial transformation of the images was performed in Fiji for microscopy (rotation and cropping) to match the imaged tissue region and orientation of both modalities. For precise registration we used symmetric normalisation (SyNRA) as transformation, consisting of rigid, affine and deformable transformation, and Mattes mutual information as optimisation metric implemented in the ANTs library30. We down-sampled the microscopy image, using linear interpolation, to the same spatial dimensions as the MALDI image using the Python package ImgAug (https://github.com/aleju/imgaug). The down-sampled AF from microscopy was used as moving image and the UMAP image from MSI, which visualises the main tissue structure similar to the AF image, was used as fixed image. We validated the registration result by the Jaccard index for the overlap between registered urothelial mask from microscopy and MSI mask. We applied spatial k-means clustering on the MSI data and selected the cluster containing the urothelium. The urothelial mask from microscopy was manually created.
Statistics and reproducibility
All experiments were conducted once. No measures were taken to verify the reproducibility of the experimental findings, as the primary objective was to demonstrate the software’s applicability by a proof-of-concept study.
Reporting summary
Further information on research design is available in the Nature Portfolio Reporting Summary linked to this article.