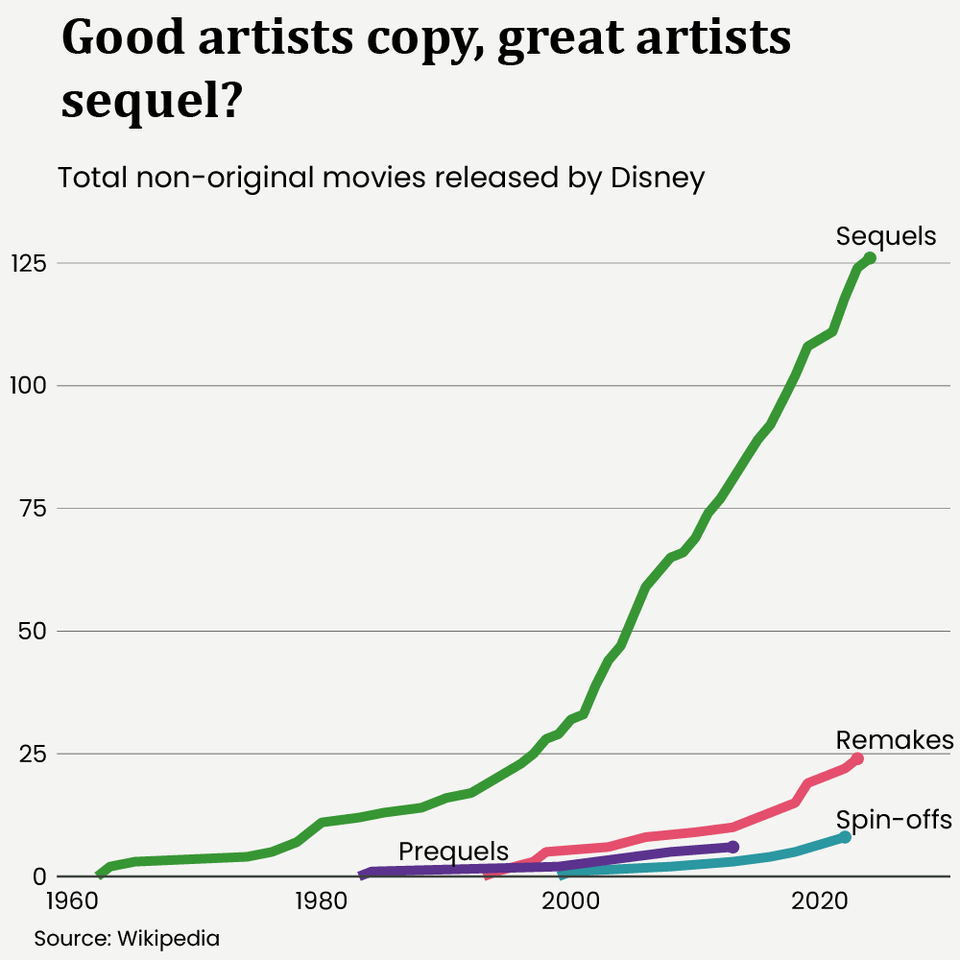
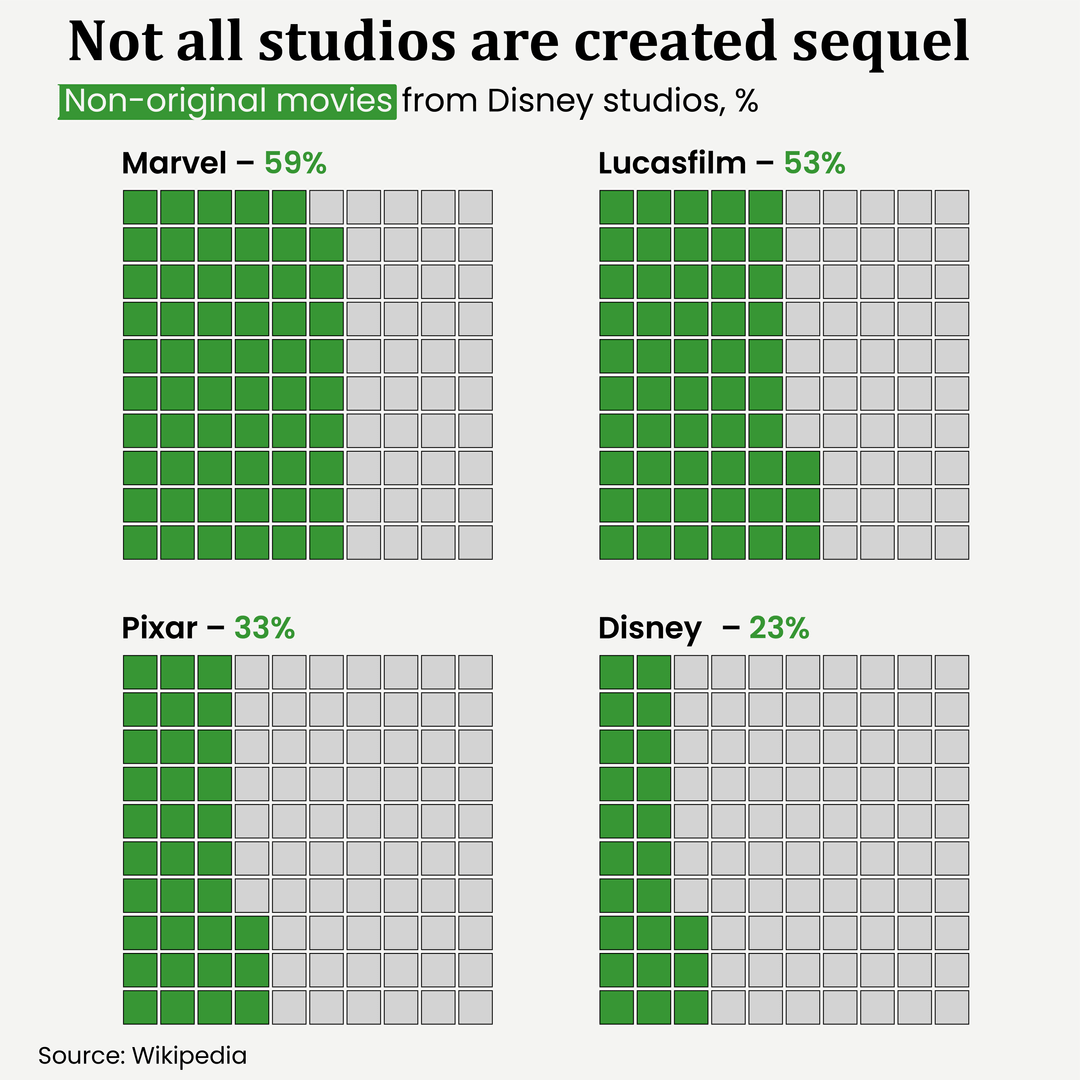
This post looks at the number of originals, sequels, remakes, prequels and tie-in movies released by four Disney studios: Walt Disney Pictures, Marvel Studios, Lucasfilm and Pixar every year since each studio was founded.
________________________________________
Made in R with ggplot2 and the wider Tidyverse and tidied in Adobe Illustrator.
________________________________________
Data collected as of October 2024.
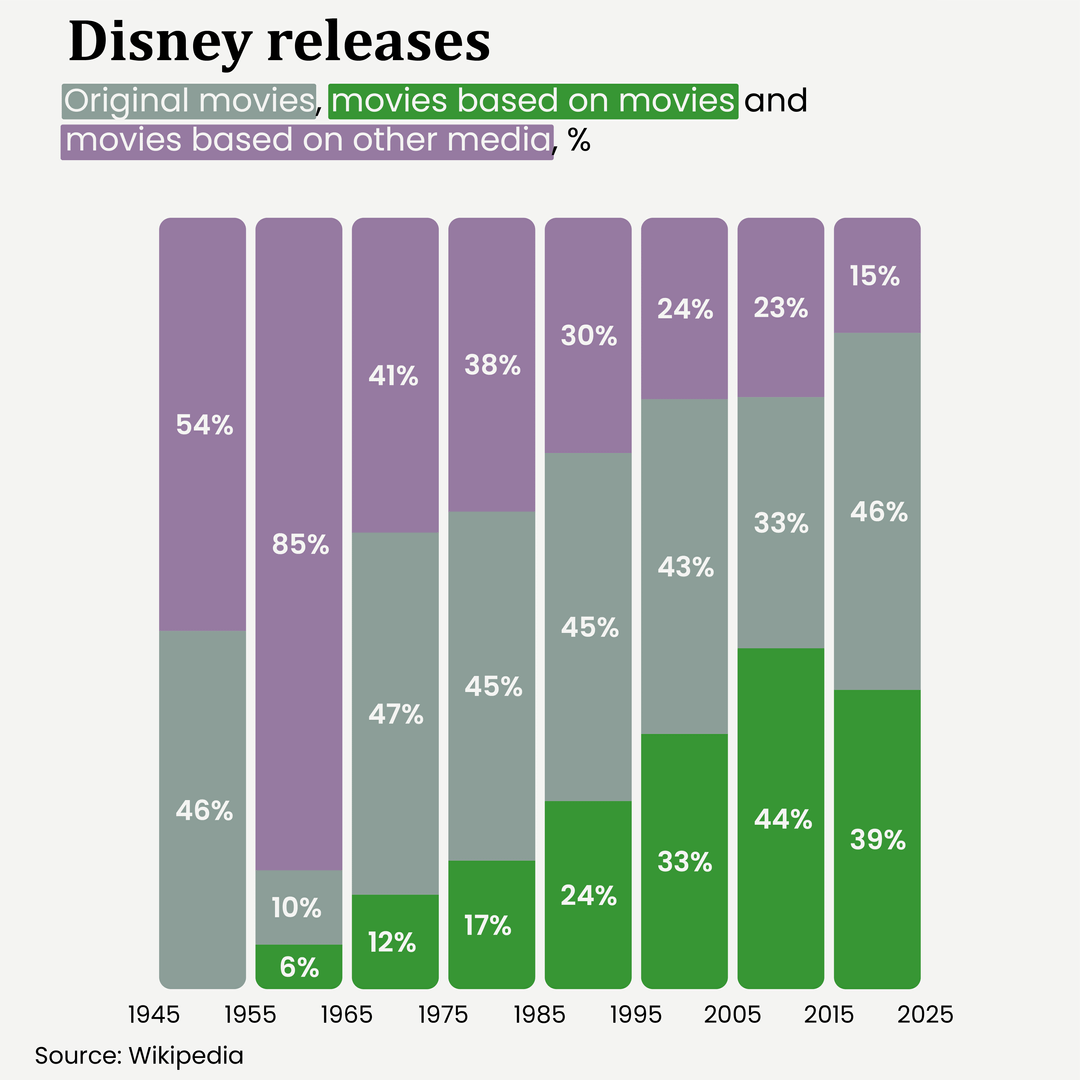
Lists of movies from each studio were sourced from Wikipedia and categorized manually by the author.
Why is image 1 showing cumulative figures? The slope has decreased its acceleration, so the number of sequels is decreasing per year?
This is interesting although it also brings up what original should mean. For example, not sure if Pinocchio is considered original but the story was from 1883
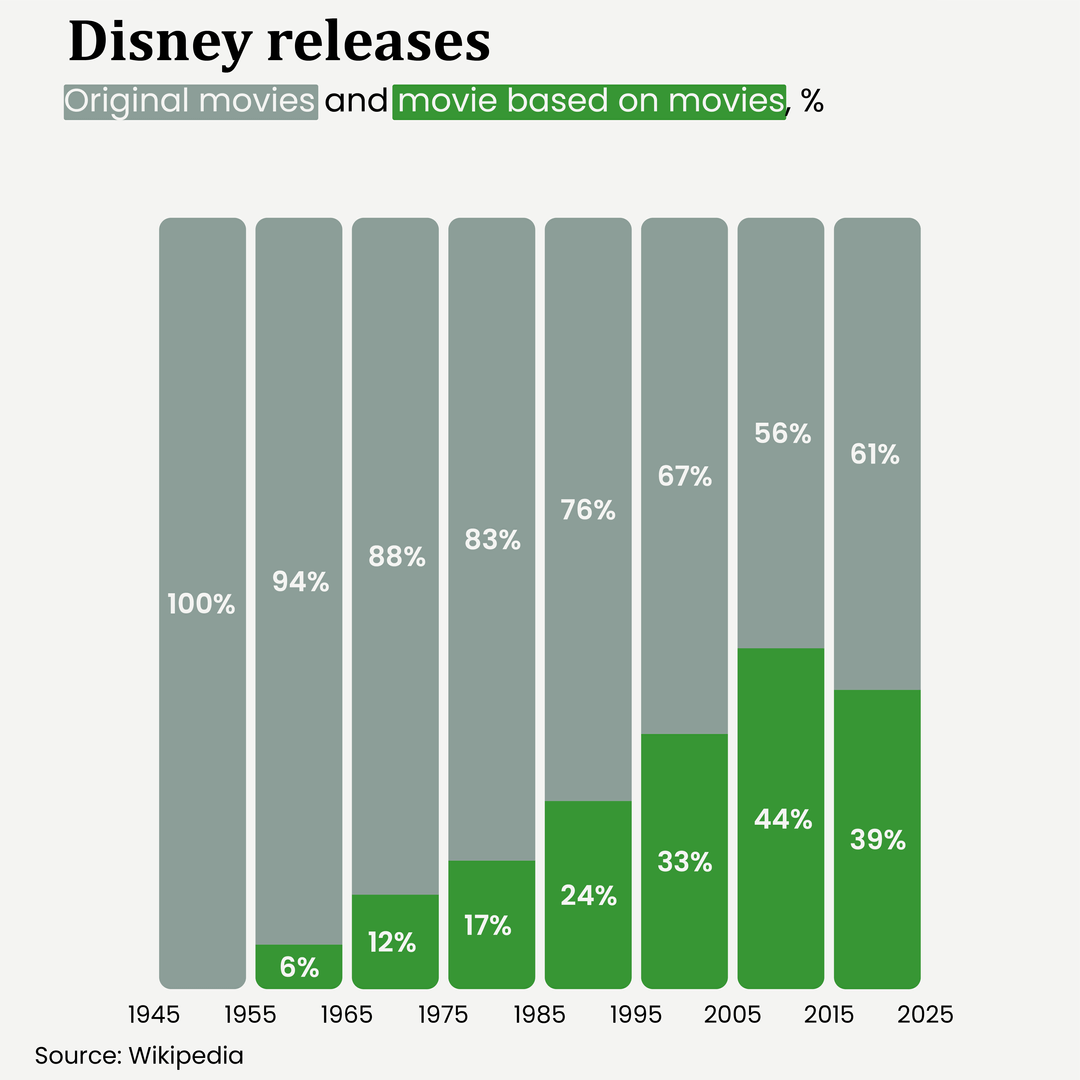
Edit: Nevermind, just seen the last image
I am a simple man, i can read the graphs, i upvote
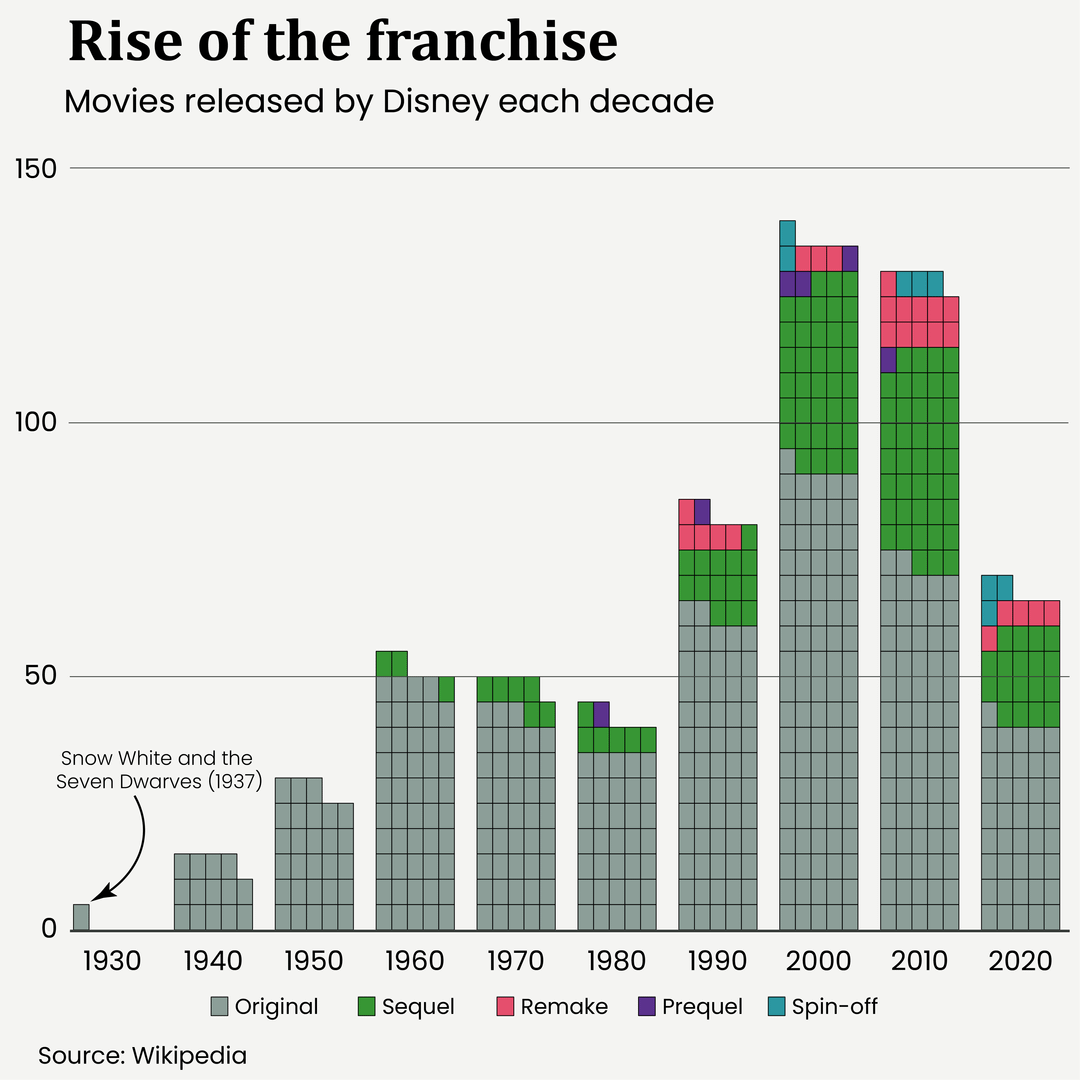
It would have been nice if the “Originals” were shown along with the non-originals in the first graph. At a casual glance, it might look like all that Disney is doing is sequels which the 2nd graph refutes.
5 comments
This post looks at the number of originals, sequels, remakes, prequels and tie-in movies released by four Disney studios: Walt Disney Pictures, Marvel Studios, Lucasfilm and Pixar every year since each studio was founded.
________________________________________
Made in R with ggplot2 and the wider Tidyverse and tidied in Adobe Illustrator.
________________________________________
Data collected as of October 2024.
Lists of movies from each studio were sourced from Wikipedia and categorized manually by the author.
Data sources:
* Walt Disney Pictures [[1](https://en.wikipedia.org/wiki/List_of_Walt_Disney_Pictures_films)]
* Marvel Studios [[2](https://en.wikipedia.org/wiki/List_of_Marvel_Cinematic_Universe_films)]
* Lucasfilm [[3](https://en.wikipedia.org/wiki/List_of_Lucasfilm_productions)]
* Pixar [[4](https://en.wikipedia.org/wiki/List_of_Pixar_films)]
I also provide some more insight on these charts on my blog (2 min read):
[https://lazyscribe.com/2025/01/31/disney-sequels/](https://lazyscribe.com/2025/01/31/disney-sequels/)
Why is image 1 showing cumulative figures? The slope has decreased its acceleration, so the number of sequels is decreasing per year?
This is interesting although it also brings up what original should mean. For example, not sure if Pinocchio is considered original but the story was from 1883
Edit: Nevermind, just seen the last image
I am a simple man, i can read the graphs, i upvote
It would have been nice if the “Originals” were shown along with the non-originals in the first graph. At a casual glance, it might look like all that Disney is doing is sequels which the 2nd graph refutes.
Nevertheless, it is a nice representation!
Comments are closed.