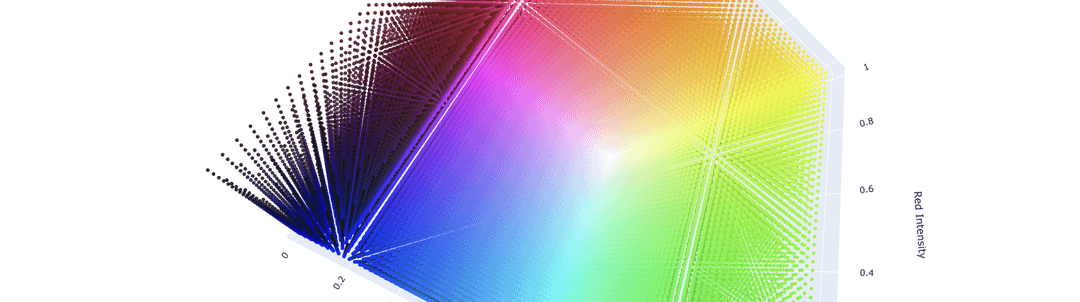
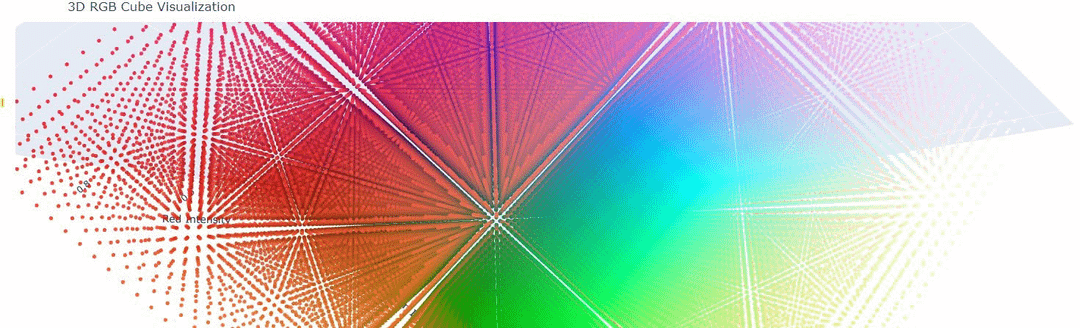
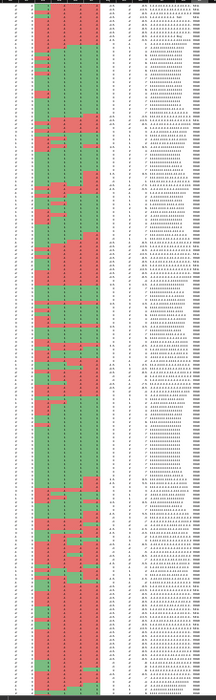
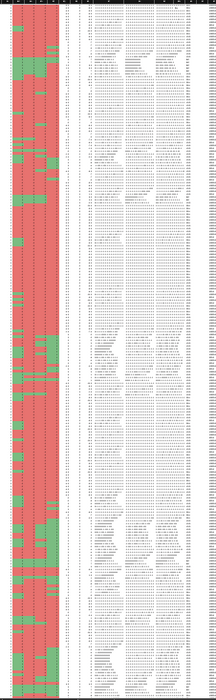

Sacred Geometry in Data | Signal generation using sequenced data | Can see emergent market signals as the data flows through the cube | cool visuals | #notacompany
Posted by Internal_Vibe
Sacred Geometry in Data | Signal generation using sequenced data | Can see emergent market signals as the data flows through the cube | cool visuals | #notacompany
Posted by Internal_Vibe
4 comments
Soz boys, pretty ripped
Here’s the link
https://www.kaggle.com/code/callummaystone/active-graph-4dcolour
I have no idea what I’m looking at
Working on an open source tool for anyone to be able to install map and inspect financial data and visualise patterns. apply their own rules and logic with an API into trading systems for free
Sorry not good with English
Beautiful, yes – but where data?
Comments are closed.