![[OC] US Border Apprehensions & Fentanyl Seizures by Month](https://www.europesays.com/wp-content/uploads/2025/02/dbcbkvasorge1-1920x1024.png)
Graphic by me, created with excel. All data from US Customs and Border Protection.
Data and further information here: https://www.factcheck.org/2025/01/illegal-immigration-and-fentanyl-at-the-u-s-northern-and-southwest-borders/
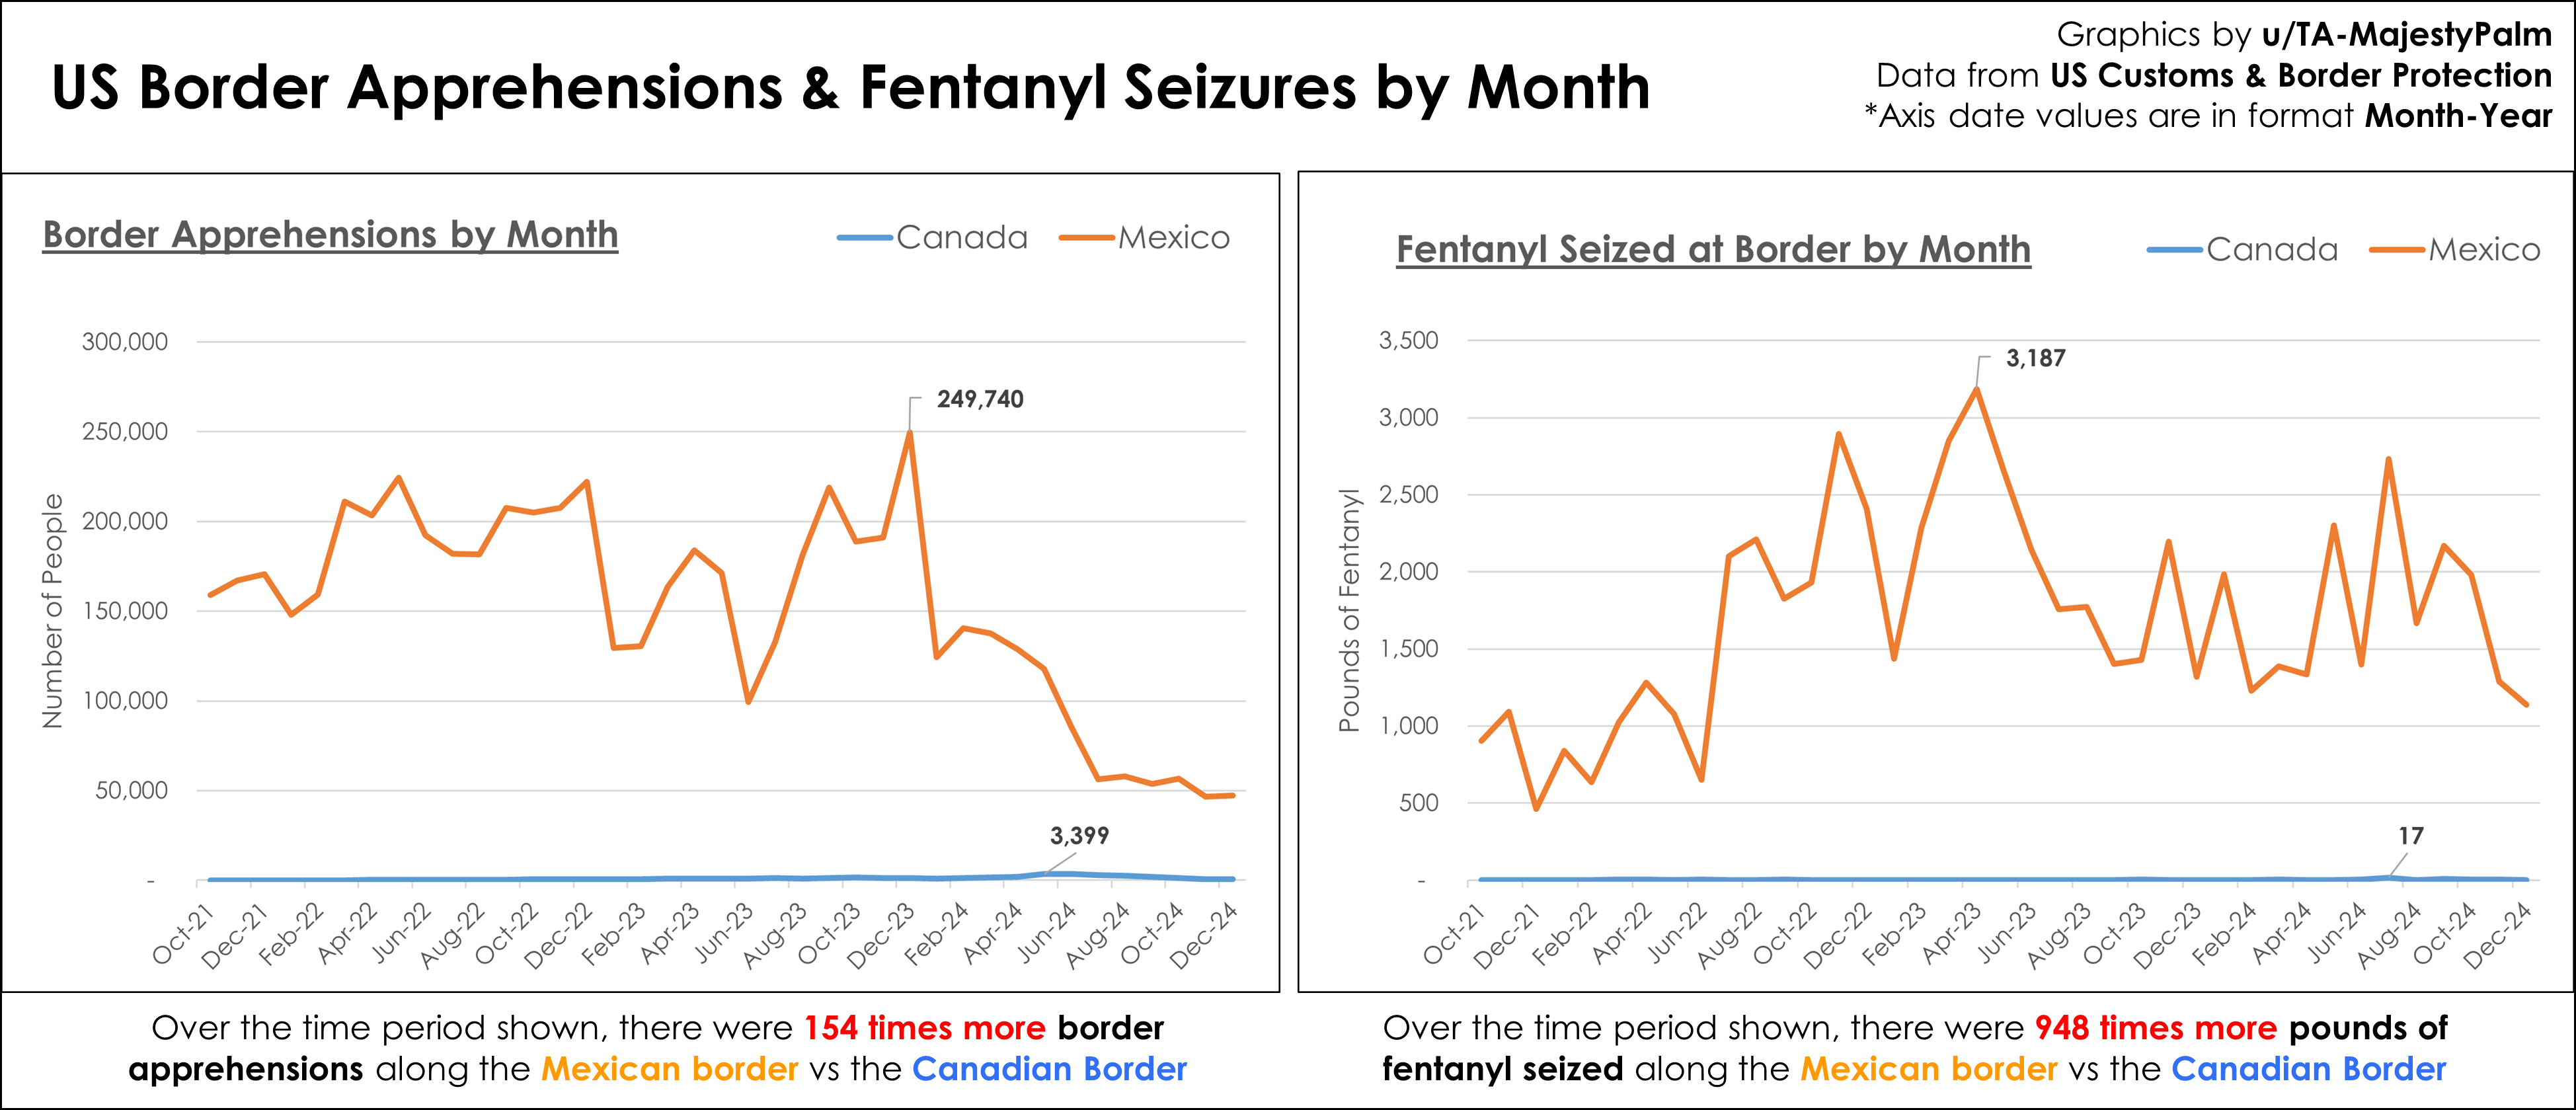
This graphic compares the US's border with Canada and Mexico, showing border apprehensions and pounds of fentanyl seized.
This was of course inspired by the recent tariffs laid on Canada and Mexico, with the reasoning from the administration being illegal immigrants and fentanyl coming from both countries. It is clear there is a massive difference in volume from the northern and southern borders.
Posted by TA-MajestyPalm
5 comments
Graphic by me, created with excel. All data from US Customs and Border Protection.
Data and further information here: https://www.factcheck.org/2025/01/illegal-immigration-and-fentanyl-at-the-u-s-northern-and-southwest-borders/
This graphic compares the US’s border with Canada and Mexico, showing border apprehensions and pounds of fentanyl seized.
This was of course inspired by the recent tariffs laid on Canada and Mexico, with the reasoning from the administration being illegal immigrants and fentanyl coming from both countries. It is clear there is a massive difference in volume from the northern and southern borders.
We need log scale for y to be able to read Canada’s data 🤣🤣
>This was of course inspired by the recent tariffs laid on Canada and Mexico,
ya, I don’t think Trump putting Tariffs on Canada had anything to do with border issues.
This shows in data that the fentanyl claim is just pretext.
He’s trying to offset federal revenue lost to his tax cuts for the super rich and corporations.
To my American friends, Please watch the speech Trudeau did, it speaks directly to Americans and NONE of the major news outlets down there even mentioned it. [https://www.youtube.com/watch?v=xiaACQpFUfE&t=3s](https://www.youtube.com/watch?v=xiaACQpFUfE&t=3s)
Spread it around if you can.
Comments are closed.