This study employed a three stages methodology to develop and implement a comprehensive respiratory infection management dashboard, ensuring a rigorous and replicable process.
Phase 1: Identification of key variables
To establish the foundational dataset, a combined approach of a literature review of existing studies and dashboards, alongside semi-structured interviews with experts in public health, IT, health management, and epidemiology. A systematic review was conducted across databases such as PubMed, Scopus, Web of Science, and Google Scholar to identify a standardized minimum dataset for designing a Power BI-based dashboard for managing viral respiratory infections (VRIs). Using MeSH terms and expert consultation, keywords such as ŌĆ£electronic health record, HER, database management system, DBMS, information management system, hospital information system, data management system, early warning system, influenza like illness, VRI, COVID 19, outbreak, dashboard and terms related to respiratory infections were refined, and search syntax was developed, with data extracted following PRISMA guidelines. We screened titles, abstracts, and full texts to gather relevant data. The inclusion/ exclusion criteria included: original papers, review articles, peer-reviewed studies, and English language articles specifically related to the minimum dataset and dashboards for ILI were included. Letters to the editor, conference papers, theses, brief articles, and blog reports were excluded.
A qualitative content analysis approach was employed to gather expert insights on essential design elements, focusing on features, attributes, and data requirements. Fifteen participants with at least five years of experience in epidemiology, public health, IT, or data science were purposively sampled until data saturation was achieved. Each interview lasted between 45 and 60┬Āmin and was audio-recorded with participant consent. Transcripts were created from the recordings, and field notes were taken to capture additional insights and contextual nuances. Semi-structured interviews explored key dashboard features, navigation components, and real-time data integration needs. Transcripts were analyzed through open, axial, and selective coding to identify themes such as user interface design, data harmonization, and decision support requirements. Credibility was ensured via member checking, peer debriefing, and an audit trail. The findings provide a robust foundation for developing a user-friendly, data-driven Power BI dashboard optimized for real-time public health decision-making in the context of RIs. The variables encompassed critical aspects of infectious disease monitoring, including demographic, clinical, laboratory, geographic, and resource allocation data. Thematic analysis was used to synthesize qualitative data from the interviews, grouping variables into distinct categories and themes. A consensus-building workshop with healthcare stakeholders was then conducted to validate the relevance and applicability of these variables and ensure alignment with operational needs.
Phase 2: Dashboard Development process
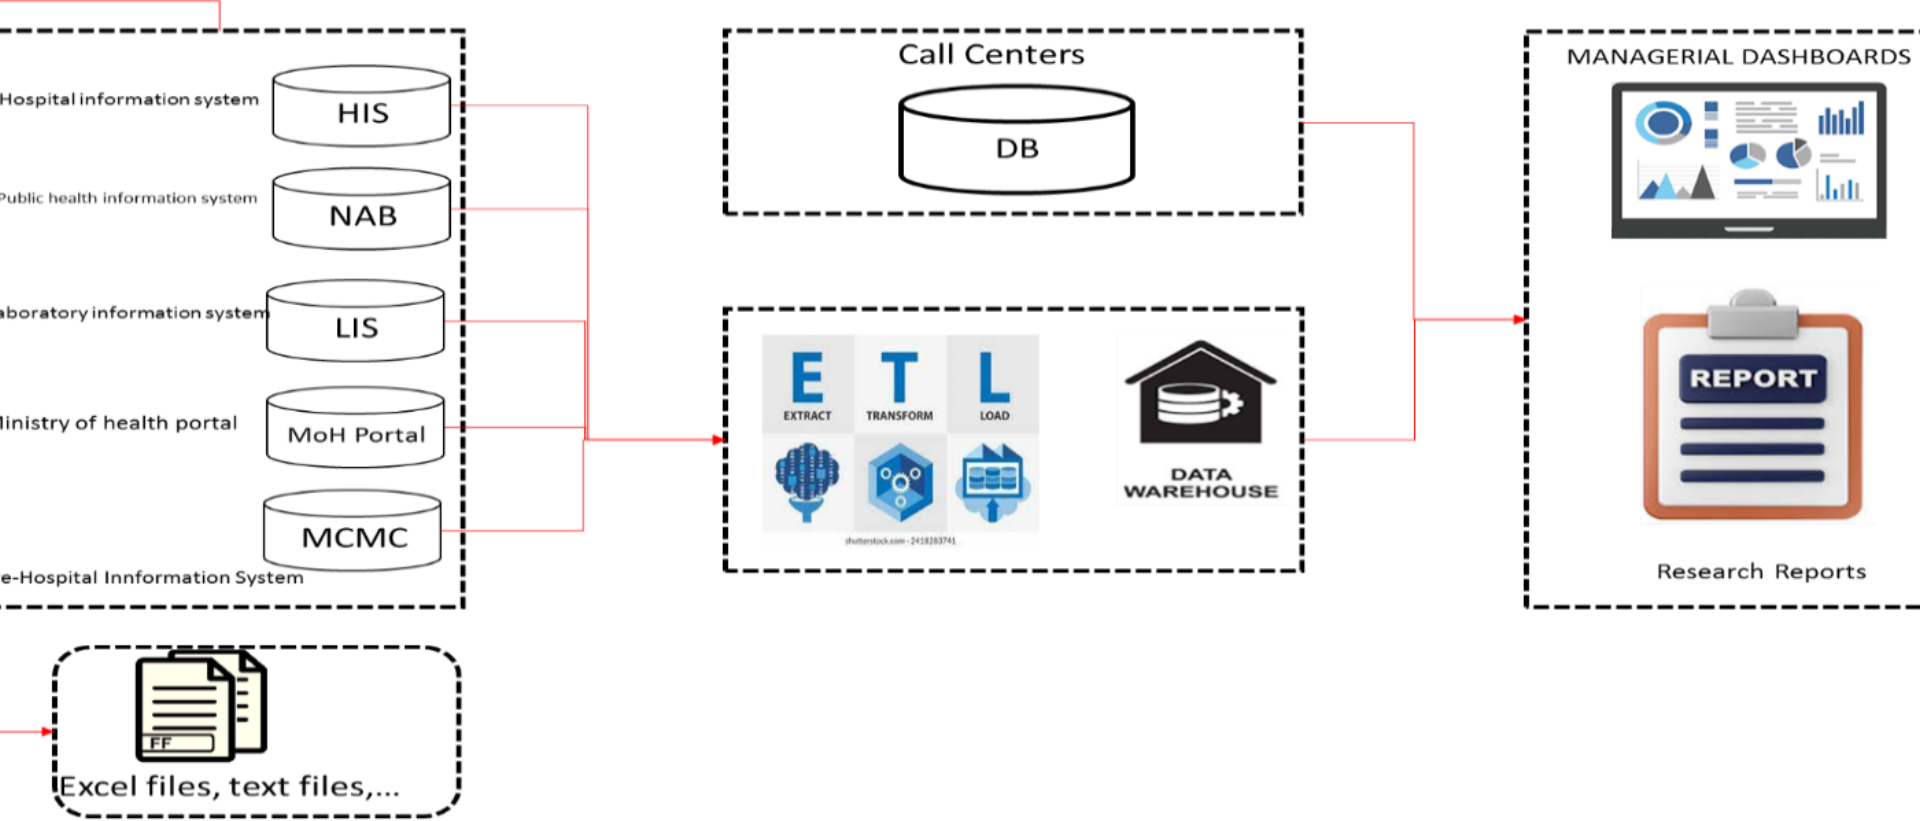
Data integration and ETL process
The dashboard was developed using Microsoft Power BI, chosen for its robust data integration capabilities, interactive visualization tools, and ability to handle large datasets efficiently. This platform allowed for seamless integration of data from multiple sources and the creation of user-friendly dashboards tailored to the needs of public health professionals.
NAB
Primary healthcare data, providing demographic details and socio-economic factors.
Hospital Information Systems (HIS)
Clinical data, including symptoms, diagnoses, hospitalizations, and discharge outcomes.
Laboratory Information Systems (LIS)
Test results, positivity rates, and diagnostic trends.
Ministry of Health Portals for Influenza Surveillance System
Data on ILI cases, including test results and vaccination records.
Medical Crisis Management Command (MCMC)
Emergency data such as ICU admissions and ventilator usage (Table┬Ā1).
Prior to loading into Power BI, data was consolidated and pre-processed in Microsoft Excel. This included rigorous data cleaning to remove duplicate records (identified using unique identifiers such as patient national ID, name, and surname) and address inconsistencies. The data then underwent an Extract, Transform, and Load (ETL) process: [1] Extraction: Retrieving raw data; [2] Transformation: Cleaning, standardizing, and calculating key metrics (prevalence, incidence, hospitalization rates, and test positivity); [3] Loading: Importing the refined data into Power BI (Fig.┬Ā1).

The ETL process for Respiratory Infection Surveillance
Dashboard design and feature development
The dashboardŌĆÖs structure and features were designed to provide actionable insights for decision-makers. Power BI components such as DAX (Data Analysis Expressions), Power Query, and Power Map were utilized to create an interactive and user-friendly interface. Key sections of the dashboard include.
Demographic analysis
Visualizing population characteristics, including age, gender, and socio-economic factors, to identify vulnerable groups.
Trend analysis
Monitoring case counts, hospitalization metrics, and vaccination rates over time.
Predictive tools
Employing control charts (CUSUM and EWMA) to forecast potential outbreaks and assess intervention effectiveness.
Geospatial mapping
Highlighting hotspots and resource distribution using dynamic maps.
The dashboard design prioritized usability, incorporating intuitive navigation menus and interactive visualizations to facilitate rapid decision-making. Performance optimization techniques, such as data aggregation and query reduction, were applied to ensure real-time responsiveness.
Phase 3: Validation and testing
Upon completion of the system design and dashboard creation, validation of the dashboard was conducted using real-world data from the aforementioned healthcare subsystems. Usability testing was conducted with 15 public health professionals with experience in infectious disease surveillance and management. Participants were selected based on their roles and expertise in epidemiology, public health administration, data analysis. The usability testing assessed the dashboard based on three key criteria: [1] Ease of Navigation: the accessibility and intuitiveness of the user interface; [2] Accuracy: the reliability of the data and insights provided; and [3] Decision-Support Functionality: the effectiveness of the dashboard in informing resource allocation and outbreak management. Specific metrics used in the usability testing included task completion time, error rates. Feedback from the validation process was used to refine the dashboard, addressing issues such as visualization clarity and data filtering options. The current system can now be accessed through the provided link within the intranet of Golestan University of Medical Sciences (http://bi.goums.ac.ir/).
Prototype evaluation
The prototype underwent retrospective data analysis to evaluate its reliability and practical application. Historical datasets were employed to assess the systemŌĆÖs performance in accurately detecting trends and anomalies. This approach allowed for a systematic examination of its accuracy and responsiveness under simulated conditions. However, the prototype phase was not without limitations, as it primarily relied on retrospective data rather than real-time inputs, which may affect the generalizability of the findings.