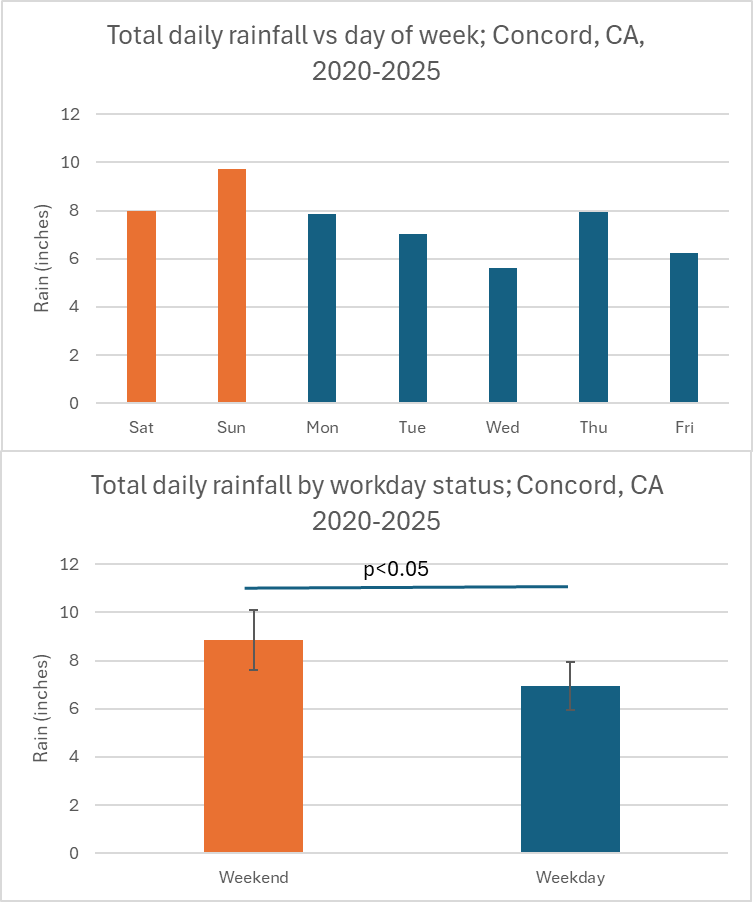
My wife and I always joke that the rain "waits till the weekend", so I downloaded the available data from ncdc.noaa.gov (station 3923734, 2020-2025, Excel for analysis and plotting) and it turns out to be true!
Of course, one would expect this level of significance by chance from 1 out of 25 stations, but I choose to believe in a malevolent cabal run by Big Umbrella!
Posted by Farty_McButtface
4 comments
Yes, this is a trend I’ve noted for decades. I appreciate your effort to prove this!
Often feels that way, but I find this hard to believe the means are 2 sigma apart. The error bars overlap. What kind of error bars are you plotting?
I remember hearing this years ago with the theory that particulate matter collects in the air as people commute for days during the workweek. This provides something for the moisture to attach to and form raindrops.
*if you cherry-pick your data hard enough
Comments are closed.