The fact that this or organized by marriage rate and not alphabetically makes my mind hurt.
Ohio is apparently NOT for lovers.
Damn Delaware, who hurt you??
Surprised nevada is not an outlier
Any ideas why D.C. is high marriage/low divorce?
What’s up with Utah? People leaving the religion?
Edit for clarity: I don’t mean the high marriage rate (expected) I meant the not low divorce rate (discouraged in LDS church)
This is an odd graphic. People’s current relationship status is more interesting than the events of a single year.
Are we just going to brush over the fact the data is represented from the ages 15+
Please don’t tell me it’s legal to get married at 15 in some US states?
Whether you’re for or against celebrating Valentine’s Day, this chart has something for you. For instance, if you don’t want to feel like a third wheel, avoid Washington, DC and Utah—they have the nation’s highest marriage rates. But if you’re looking to meet someone who is recently divorced, Alaska (though sparsely populated) is a good bet.
Washington, DC, had the nation’s highest marriage rate in 2023 with 22.5 marriages per every 1,000 women. Utah has the highest of all states with 21.9, and Alaska followed with 20.9.
Alaska’s relatively high marriage rate is paired with the highest divorce rate nationwide, 9.9 divorces per 1,000 marriages. This may be age-related; marriage rates are impacted by a population’s age, and are generally higher in states with younger populations. Alaska has the fifth-lowest median age in the US, 36.1.
The lowest divorce rate in the nation was in Vermont, with 4.4 divorces per 1,000 marriages and an average age of 43.4. Vermont is the-third oldest state in the nation behind Maine (44.8) and New Hampshire (43.4).
Another way to measure marriage is the share of people that have ever been married in a state. Nationally, 65.5% of people older than 15 have been married at least once.
State-wise, Idaho has the largest proportion of residents who have ever married, at 71.6%, while New York has the lowest at 61.4%. Idaho’s median age is 37.6 years old, compared to New York’s 40.1. Idaho has a high percentage of married residents despite having one of the youngest median ages in the country— six states and Washington, DC, have a lower median age than the Gem state.
Washington, DC, is an outlier, with 45.6% of its residents having ever married, the lowest share nationwide.
Looking at marriages occurring in a single year is inherently misleading. As much as anything, this is a graphic of where young people live.
The statistic you want is the proportion of the population who is married, not the number who got married in 2023.
New York was one the last state to permit no-fault divorce in 2010. People at the time, and throughout the 20th century in other states, were travelling out-of-state (if they had the means and will) to get divorced.
The thing is that from the literature I’ve read, no-fault divorce (coupled with a responsive legal or ideally mediation system) is actually better for family stability (and especially child welfare) than forcing irreconcilable marriages to remain in some de facto effect. And legalizing them did not raise NY’s divorce rate, pretty much at all.
It’s a neat counterintuitive paradox of social science, that legal free divorce is better for family stability — ultimately the institution of marriage itself — than even simply mandating seemingly benign beneficial steps like counseling etc.
(One reason among many: It givees divorce much more possibility to be more amicable for families that they don’t have to scrounge up evidence of infidelity or cruelty (if it was not otherwise obvious or nonexistent or not the reason), and present in open court, first to seek divorce; or even if it is mutually agreed to make it up beforehand for the sake of expediency or go out of state, it’s still unnecessary stress on one of the worst times in a family’s life.)
Interesting. The marriage rate correlates strongly with median age which is a logical explanation. The interesting part to me is that divorces don’t.
I feel like this is measuring age demographics and claiming it’s measuring marriage and divorce
The order of words in the title does not help me keep track of what I’m looking at. Then again, neither does the plot.
Could you please put if the state is democratic or republicans?
Should be two slides, with the other slide being sorted on divorce rate 😀
I do not like that it starts at age 15+
This is a poor visualization of the data. It gives the appearance that divorce rates should be on a negative space and you keep looking for a neutral axis (a la a forest plot). There is no sense in putting both divorce and marriage rate on the same line. A better chart could even have been a simple bar chart to convey the point without causing confusion.
Alaska should have a stipulation to get a marriage license you have to spend one winter alone together in a cabin. If you didn’t murder each other and still want to get married, you have the state’s blessing.
It appears the more expensive it is tI live in the state the more people stay together.
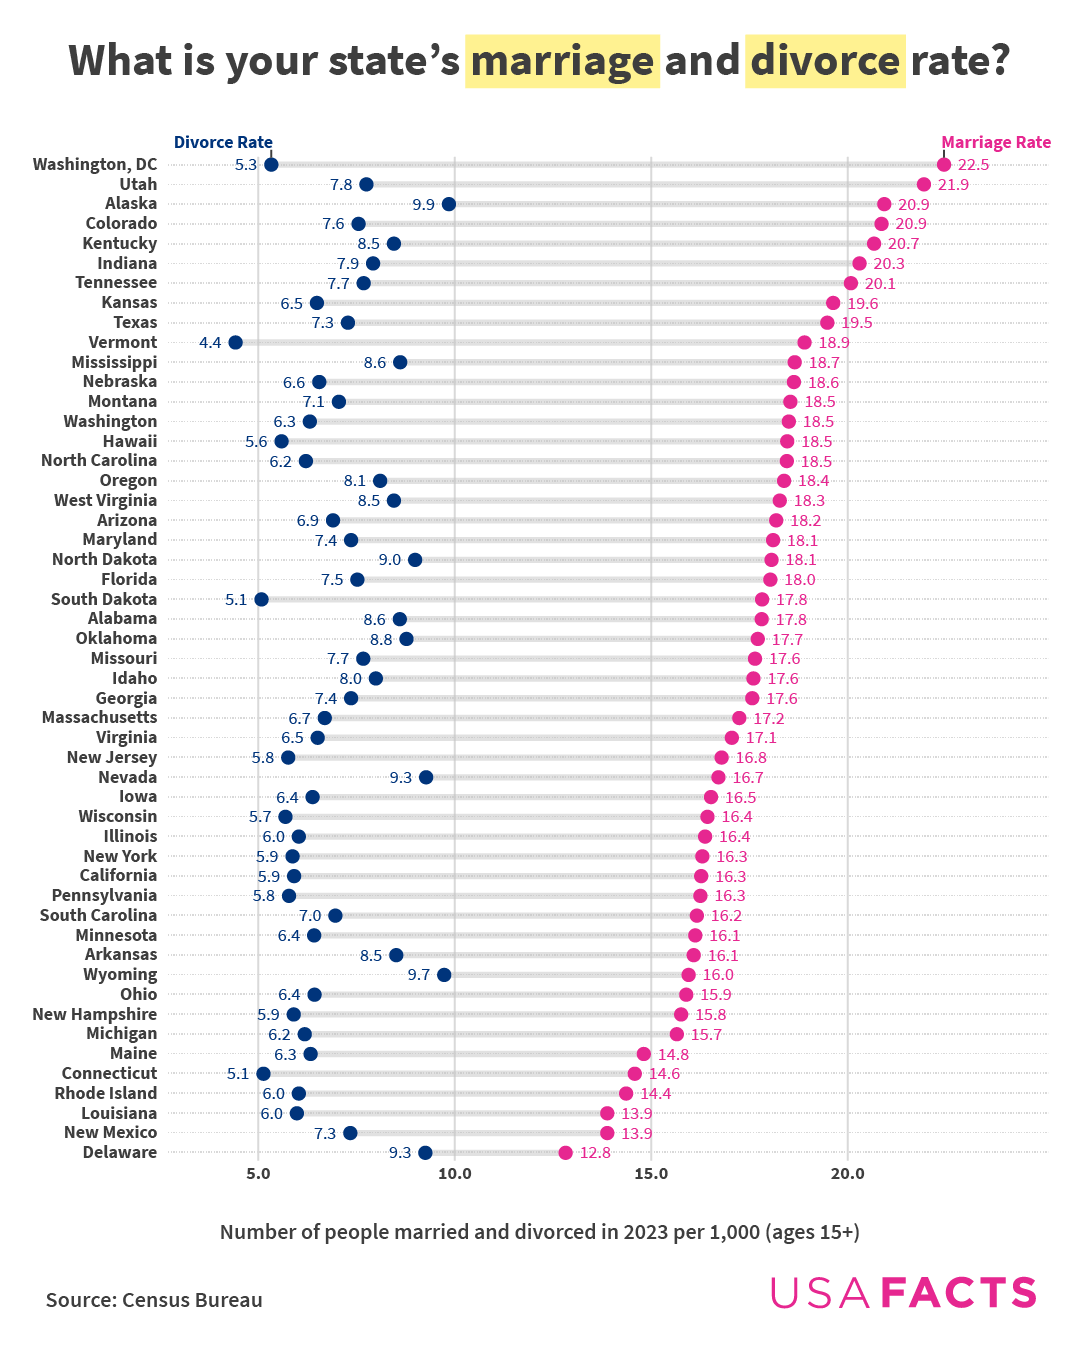
![Marriage and divorce rates by state [OC]](https://www.europesays.com/wp-content/uploads/2025/02/knvivpbz3rie1-1080x1024.png)
25 comments
Source: [US Census Bureau](https://data.census.gov/table/ACSDT1Y2023.B12501?q=divorces%20in%20the%20last%20year&g=010XX00US$0400000&moe=false&tp=false)
Tools: Datawrapper, Illustrator
Note: The Census Bureau [calculates marriage and divorce rate](https://www.census.gov/library/stories/2024/10/marriage-and-divorce.html) by looking at the “number of women who married or divorced in the last year per 1,000 women age 15 and over.” The calculation relies on women due to Census [research](https://www.census.gov/content/dam/Census/library/working-papers/2007/acs/2007_OConnell_01.pdf) finding that [women report data on themselves](https://www.census.gov/library/stories/2023/07/marriage-divorce-rates.html) more often and more accurately than men.
More data on marriage by state [here](https://usafacts.org/articles/how-does-marriage-vary-by-state/), and more data on marriage over time [here](https://usafacts.org/articles/state-relationships-marriages-and-living-alone-us/).
The fact that this or organized by marriage rate and not alphabetically makes my mind hurt.
Ohio is apparently NOT for lovers.
Damn Delaware, who hurt you??
Surprised nevada is not an outlier
Any ideas why D.C. is high marriage/low divorce?
What’s up with Utah? People leaving the religion?
Edit for clarity: I don’t mean the high marriage rate (expected) I meant the not low divorce rate (discouraged in LDS church)
This is an odd graphic. People’s current relationship status is more interesting than the events of a single year.
Are we just going to brush over the fact the data is represented from the ages 15+
Please don’t tell me it’s legal to get married at 15 in some US states?
Whether you’re for or against celebrating Valentine’s Day, this chart has something for you. For instance, if you don’t want to feel like a third wheel, avoid Washington, DC and Utah—they have the nation’s highest marriage rates. But if you’re looking to meet someone who is recently divorced, Alaska (though sparsely populated) is a good bet.
Washington, DC, had the nation’s highest marriage rate in 2023 with 22.5 marriages per every 1,000 women. Utah has the highest of all states with 21.9, and Alaska followed with 20.9.
Alaska’s relatively high marriage rate is paired with the highest divorce rate nationwide, 9.9 divorces per 1,000 marriages. This may be age-related; marriage rates are impacted by a population’s age, and are generally higher in states with younger populations. Alaska has the fifth-lowest median age in the US, 36.1.
The lowest divorce rate in the nation was in Vermont, with 4.4 divorces per 1,000 marriages and an average age of 43.4. Vermont is the-third oldest state in the nation behind Maine (44.8) and New Hampshire (43.4).
An interesting note on how the Census Bureau calculates this though… They [calculate marriage and divorce rate](https://www.census.gov/library/stories/2024/10/marriage-and-divorce.html) by looking at the “number of *women* who married or divorced in the last year per 1,000 women age 15 and over.” Why? Well, the calculation relies on women due to Census [research](https://www.census.gov/content/dam/Census/library/working-papers/2007/acs/2007_OConnell_01.pdf) finding that [women report data on themselves](https://www.census.gov/library/stories/2023/07/marriage-divorce-rates.html) more often and more accurately than men. So it’s likely an imperfect measure, but it’s also the best we’ve got.
Another way to measure marriage is the share of people that have ever been married in a state. Nationally, 65.5% of people older than 15 have been married at least once.
State-wise, Idaho has the largest proportion of residents who have ever married, at 71.6%, while New York has the lowest at 61.4%. Idaho’s median age is 37.6 years old, compared to New York’s 40.1. Idaho has a high percentage of married residents despite having one of the youngest median ages in the country— six states and Washington, DC, have a lower median age than the Gem state.
Washington, DC, is an outlier, with 45.6% of its residents having ever married, the lowest share nationwide.
More data on marriage by state [here](https://usafacts.org/articles/how-does-marriage-vary-by-state/), and more historical data [here](https://usafacts.org/articles/state-relationships-marriages-and-living-alone-us/), including a look at how median ages of marriage have changed.
Looking at marriages occurring in a single year is inherently misleading. As much as anything, this is a graphic of where young people live.
The statistic you want is the proportion of the population who is married, not the number who got married in 2023.
New York was one the last state to permit no-fault divorce in 2010. People at the time, and throughout the 20th century in other states, were travelling out-of-state (if they had the means and will) to get divorced.
The thing is that from the literature I’ve read, no-fault divorce (coupled with a responsive legal or ideally mediation system) is actually better for family stability (and especially child welfare) than forcing irreconcilable marriages to remain in some de facto effect. And legalizing them did not raise NY’s divorce rate, pretty much at all.
It’s a neat counterintuitive paradox of social science, that legal free divorce is better for family stability — ultimately the institution of marriage itself — than even simply mandating seemingly benign beneficial steps like counseling etc.
(One reason among many: It givees divorce much more possibility to be more amicable for families that they don’t have to scrounge up evidence of infidelity or cruelty (if it was not otherwise obvious or nonexistent or not the reason), and present in open court, first to seek divorce; or even if it is mutually agreed to make it up beforehand for the sake of expediency or go out of state, it’s still unnecessary stress on one of the worst times in a family’s life.)
Interesting. The marriage rate correlates strongly with median age which is a logical explanation. The interesting part to me is that divorces don’t.
This is not what I like seeing in 2025…
https://preview.redd.it/ok2t9vts7rie1.png?width=648&format=png&auto=webp&s=2f30287764ea0c39f7220d10b012509f32f12b87
I feel like this is measuring age demographics and claiming it’s measuring marriage and divorce
The order of words in the title does not help me keep track of what I’m looking at. Then again, neither does the plot.
Could you please put if the state is democratic or republicans?
Should be two slides, with the other slide being sorted on divorce rate 😀
I do not like that it starts at age 15+
This is a poor visualization of the data. It gives the appearance that divorce rates should be on a negative space and you keep looking for a neutral axis (a la a forest plot). There is no sense in putting both divorce and marriage rate on the same line. A better chart could even have been a simple bar chart to convey the point without causing confusion.
Alaska should have a stipulation to get a marriage license you have to spend one winter alone together in a cabin. If you didn’t murder each other and still want to get married, you have the state’s blessing.
It appears the more expensive it is tI live in the state the more people stay together.
https://preview.redd.it/9el0kvlycrie1.png?width=73&format=png&auto=webp&s=58023d2b4f5c2364053df901f3663b3d0241ba2f
WHAT
It would be interesting to see this compared to the average age people get married at.
Ages 15+??? Is that the legal age for marriage in the US?! In some countries it is still below the age of consent!
Comments are closed.