My 30 min lunch thought experiment went into a 2 hour research process. Finding the data has not been easy. I have changed the metric from individual income, to household income.
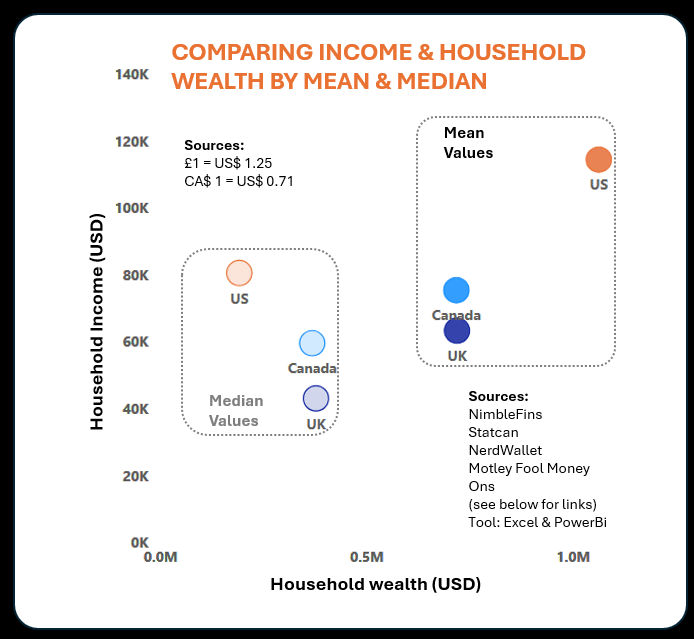
Still think it is interesting seeing how mean vs median real tell two completely different stories :)D
See below for my links:
Tool: PowerBi, Excel
Sources:
UK |Average Household Savings & Wealth UK 2025 | NimbleFins|Wealth 2024
UK |https://www.ons.gov.uk/peoplepopulationandcommunity/personalandhouseholdfinances/incomeandwealth/datasets/householddisposableincomeandinequality|Income (2023)
You should probably remove home value from wealth.
That distorts the picture.
now take off the, say, 5% highest income earners as the median/average is really skewing things right?
Take. Healthcare costs that regularly bankrupt Americans out of their wages and youŌĆÖll see where the number really are at. Jesus. ItŌĆÖs bad. We wouldnŌĆÖt need so much income if that wasnŌĆÖt my a thing.
That’s really quite interesting. Would this suggest that there is more mass of an entrenched wealthy class in the US than in Canada and the UK? Or rather, that once you’re over a certain hump, the “Wealth” jump happens more strongly in the US? To show that increasing salaries have such an outsized effect on wealth
The mean income in the US isn’t that crazy much higher than the median (~120k vs ~80k) but the mean vs median wealth jump is really quite stark (~1.1M vs ~0.2M by eyeballing). Whereas the mean and median for both are both much closer in Canada and the UK, and the jump is much less pronounced/more proportional. It’s really quite something if the US is more prone to social stratification than the UK, but I guess that’s what privatization is intended to do.
It does seem clear that, in the US, salaries closer to median get eaten up so easily by everything being more expensive and services costing a lot of money rather than being free at use
It looks like the median values are a little more dispersed from your original post. I think the same conclusion can be drawn which is always take the mean values with a grain of salt given their tendency to skew, especially when dealing with income and wealth.
It would be interesting to see this also including disposable income and cost of living per country to see how the net income translates into accrued wealth.
Looks like US is Meaner than UK & Canada.
as my old boss used to say: *head in the oven, feet in the fridge, on average you’re doing ok*
9 comments
Revision of previous post:
My 30 min lunch thought experiment went into a 2 hour research process. Finding the data has not been easy. I have changed the metric from individual income, to household income.
Still think it is interesting seeing how mean vs median real tell two completely different stories :)D
See below for my links:
Tool: PowerBi, Excel
Sources:
UK |Average Household Savings & Wealth UK 2025 | NimbleFins|Wealth 2024
CAN|https://www150.statcan.gc.ca/t1/tbl1/en/tv.action?pid=9810006001|Income (2020)
CAN|Total and median net worth by age of main income earner and family type|Networth (2023)
US|Average American Net Worth by Age: Compare Yours – NerdWallet|Networth (2023)
US|https://www.fool.com/money/research/average-us-income/#:~:text=The%20average%20U.S.%20household%20income%20in%202023%20was,meaningful%20change%20in%20median%20income%20in%20recent%20years.?msockid=225902c090f461b33f6f161c914b606a|Income (2023)
UK |https://www.ons.gov.uk/peoplepopulationandcommunity/personalandhouseholdfinances/incomeandwealth/datasets/householddisposableincomeandinequality|Income (2023)
You should probably remove home value from wealth.
That distorts the picture.
now take off the, say, 5% highest income earners as the median/average is really skewing things right?
Take. Healthcare costs that regularly bankrupt Americans out of their wages and youŌĆÖll see where the number really are at. Jesus. ItŌĆÖs bad. We wouldnŌĆÖt need so much income if that wasnŌĆÖt my a thing.
That’s really quite interesting. Would this suggest that there is more mass of an entrenched wealthy class in the US than in Canada and the UK? Or rather, that once you’re over a certain hump, the “Wealth” jump happens more strongly in the US? To show that increasing salaries have such an outsized effect on wealth
The mean income in the US isn’t that crazy much higher than the median (~120k vs ~80k) but the mean vs median wealth jump is really quite stark (~1.1M vs ~0.2M by eyeballing). Whereas the mean and median for both are both much closer in Canada and the UK, and the jump is much less pronounced/more proportional. It’s really quite something if the US is more prone to social stratification than the UK, but I guess that’s what privatization is intended to do.
It does seem clear that, in the US, salaries closer to median get eaten up so easily by everything being more expensive and services costing a lot of money rather than being free at use
It looks like the median values are a little more dispersed from your original post. I think the same conclusion can be drawn which is always take the mean values with a grain of salt given their tendency to skew, especially when dealing with income and wealth.
It would be interesting to see this also including disposable income and cost of living per country to see how the net income translates into accrued wealth.
Looks like US is Meaner than UK & Canada.
as my old boss used to say: *head in the oven, feet in the fridge, on average you’re doing ok*
Comments are closed.