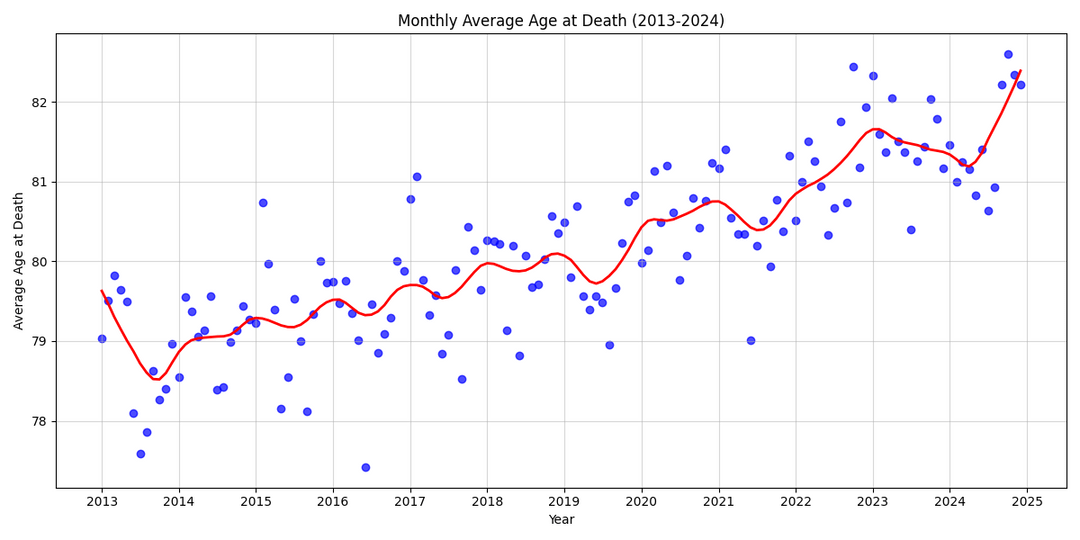
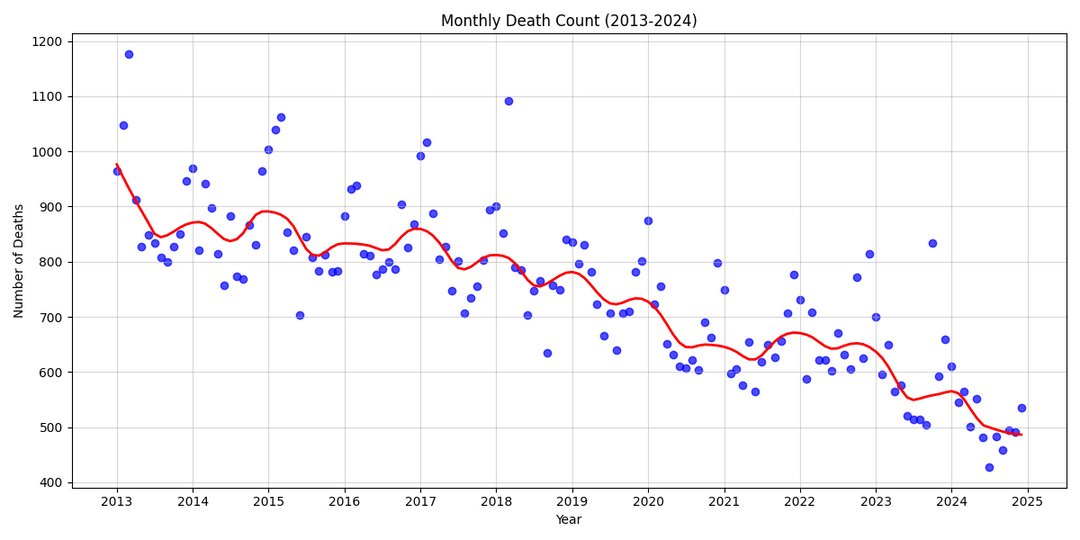
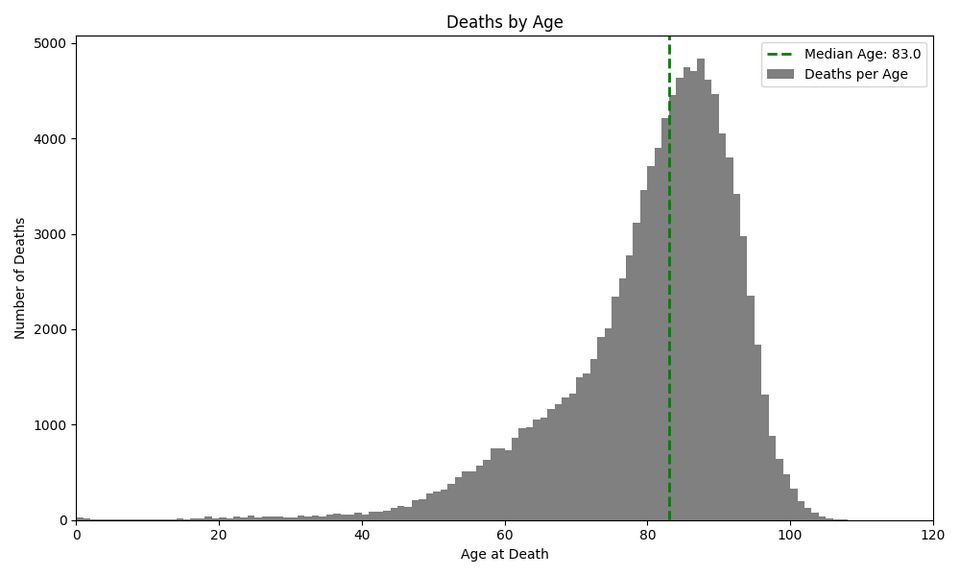
I explored mortality trends using over 125,000 obituaries from a local German newspaper. My aim was to find seasonal patterns, longevity changes, and COVID impacts. Initial results were surprising: **fewer deaths appeared to be reported over time, especially in middle age, and average age at death seemed to rise.** Was longevity dramatically increasing?
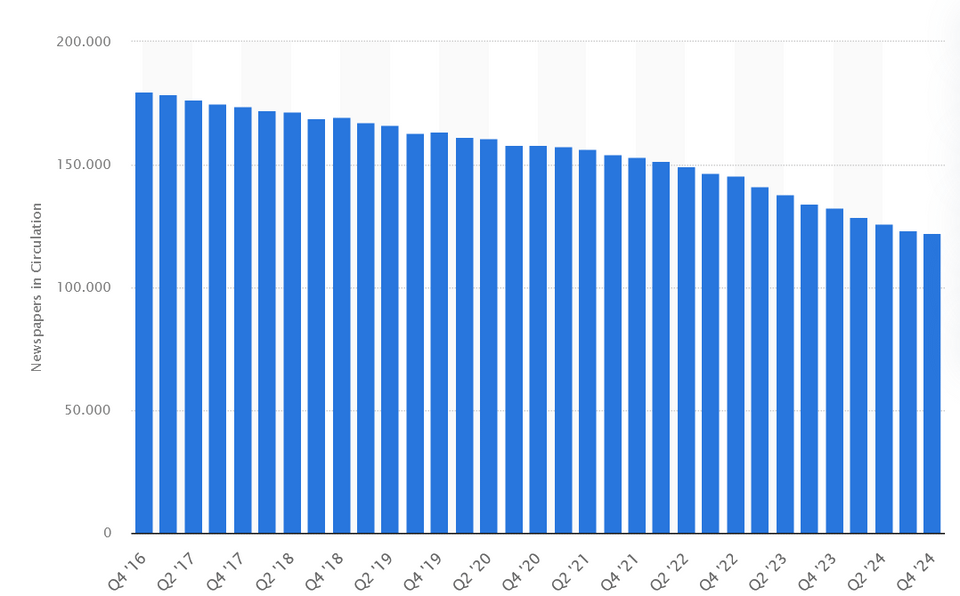
This odd finding prompted investigation beyond the data itself. My research into the newspaper revealed a significant **33% drop in circulation** (from 180,000 to 120,000 copies quarterly between 2016 and 2024).
Suddenly, the trends made sense. **The data reflected declining obituary submissions more than anything, skewing the underlying death trends.** Lower circulation meant fewer obituaries, likely with more submissions from older, traditional readers.
This highlights a vital data analysis lesson: **correlation isn’t causation.** The obituary data showed a trend, but it was driven by changing data collection (newspaper circulation), not a real societal shift in mortality. Always consider context and hidden factors influencing your data, sometimes the real story is in the data collection itself.
I love this post for leading off with a chart that implies one thing and then explaining quite cogently why the obvious conclusion is illusory.
Usually that’s the job of the commenters but in this case I can only slow clap.
Any thoughts about the apparent seasonality – in most years there’s a drop in the average age in obituaries appearing in late spring/early summer?
Before going on, recognize I am not familiar with German data specifically and am assuming it is similar to the US. I think there are a few factors that explain the increase, as someone who works in life insurance in the US:
1. A greater percentage of the population is 80+ in 2024 vs 2013. Thus the rise in the average age is partially reflective of the fact that there are more 80+ year olds to die in 2024 vs 2013.
2. Mortality improved significantly from 2013-2019. At least in the US, they slowed significantly thereafter, but my understanding is that has not been the case in Europe, Canada, and Australia.
3. A lot of the mortality improvements have been concentrated in the older ages, which, especially when coupled with 1. and 2. would push the percentage of 80+ deaths higher.


4 comments
I explored mortality trends using over 125,000 obituaries from a local German newspaper. My aim was to find seasonal patterns, longevity changes, and COVID impacts. Initial results were surprising: **fewer deaths appeared to be reported over time, especially in middle age, and average age at death seemed to rise.** Was longevity dramatically increasing?
This odd finding prompted investigation beyond the data itself. My research into the newspaper revealed a significant **33% drop in circulation** (from 180,000 to 120,000 copies quarterly between 2016 and 2024).
Suddenly, the trends made sense. **The data reflected declining obituary submissions more than anything, skewing the underlying death trends.** Lower circulation meant fewer obituaries, likely with more submissions from older, traditional readers.
This highlights a vital data analysis lesson: **correlation isn’t causation.** The obituary data showed a trend, but it was driven by changing data collection (newspaper circulation), not a real societal shift in mortality. Always consider context and hidden factors influencing your data, sometimes the real story is in the data collection itself.
I love this post for leading off with a chart that implies one thing and then explaining quite cogently why the obvious conclusion is illusory.
Usually that’s the job of the commenters but in this case I can only slow clap.
Any thoughts about the apparent seasonality – in most years there’s a drop in the average age in obituaries appearing in late spring/early summer?
Before going on, recognize I am not familiar with German data specifically and am assuming it is similar to the US. I think there are a few factors that explain the increase, as someone who works in life insurance in the US:
1. A greater percentage of the population is 80+ in 2024 vs 2013. Thus the rise in the average age is partially reflective of the fact that there are more 80+ year olds to die in 2024 vs 2013.
2. Mortality improved significantly from 2013-2019. At least in the US, they slowed significantly thereafter, but my understanding is that has not been the case in Europe, Canada, and Australia.
3. A lot of the mortality improvements have been concentrated in the older ages, which, especially when coupled with 1. and 2. would push the percentage of 80+ deaths higher.
Comments are closed.