Inspired by some of the chart from yesterday, I plotted GPU performance (Relative 1080p medium settings – data from Tom’s Hardware) against their inflation-adjusted launch prices (from the Bureau of Labor Statistics)
**High-end GPUs** like the RTX 4090 and 3090 Ti dominate performance but come with massive price tags.
**Diminishing returns** are clear at the top end—spending more doesn’t always mean significantly better performance.
here is all of my raw (and not pretty at all) data;
This is awesome. Got a 1070 in 2016. Nice to see that it was relatively speaking, at the time, a price to performance king. Still running it today.
EDIT: Need a 3d plot with 3rd axis by launch date haha
~~Illegibility is hardly beautiful. More pixels required.~~
Edit: My bad…as noted by Merisuola, this is apparently just a phone app issue with a larger graphic. I’d not encountered it before. Downvoting to bury my error.
I wish this was easier to read because the information it is presenting is good.
Could you make a similar chart for 4k? The top GPUs are CPU bottleneck at 1080p
Very interesting data, however I would have expected the axes to be flipped (performance in X, price in Y), maybe just me though.
Relative performance to what? The 4090? This doesn’t show what I think people believe it is showing. It’s basically a timeline as it is presented here.
You probably want uplift over previous generation.
Source: Make power point slides for a living.
So basically the best quality -price option is amd 7800XT
It’s missing the titan x pascal which is a pretty important card. It was the first pascal architecture titan, came out August 2016 at $1,200 and was beat to shit by the 1080ti on value/performance a few months later. The 5080 I got for $1,000 is a fucking bargain compared to the titan I got day one in 2016.
“Over time”
Provides absolutely no dates on any of the data points
How did we end up with a worse launch than covid era? Unmitigated rampant, relentless greed.
This tells us nothing, and the data set it’s analysing (1080p medium performance) isn’t even **relevant** for a lot of these cards.
You aren’t running 1080p medium on a 3070, let alone a 4090.
Always thought both versions of the 3090 were ridiculously overpriced
Is this price MSRP at launch? The last 4 generations of NVidia were paper launches and dont reflect the true price.
I’m wondering where you sourced your numbers, they don’t appear to be accurate, eg here’s techpowerup’s chart (granted there may be some settings differences, but if there wasn’t a CPU bottleneck i’d expect this sort of difference):
All this is showing is that if you are a 1080p gamer (such as I), you should go for 70 series cards.
This is like comparing every type of car on rough terrain only. You cannot go ahead and claim “expensive super cars are actually not that powerful” by that alone. We need 2K, 4K data too at the very least.
Misleading data here.
“1080p medium” settings is a terrible metric for this, as it massively undervalues the high end GPUs in terms of “Relative performance” due to other bottlenecks in the PC.
This graph would look vastly different at 1440p high settings or 4k medium settings.
Love my 4070 Super, gonna run this thing for years unless I win the lottery
You have the 4080 Super with a higher adjusted launch price than the regular 4080? It was $200 cheaper. Surely inflation didnt jump by that in 1 year (looking at a quick online calculator, it didnt).
You’d need to compare accross settings tbh, 1080 medium is obviously going to have diminishing returns.
Did you switch around the 4080 and 4080 Super? Price placement doesn’t really make sense.
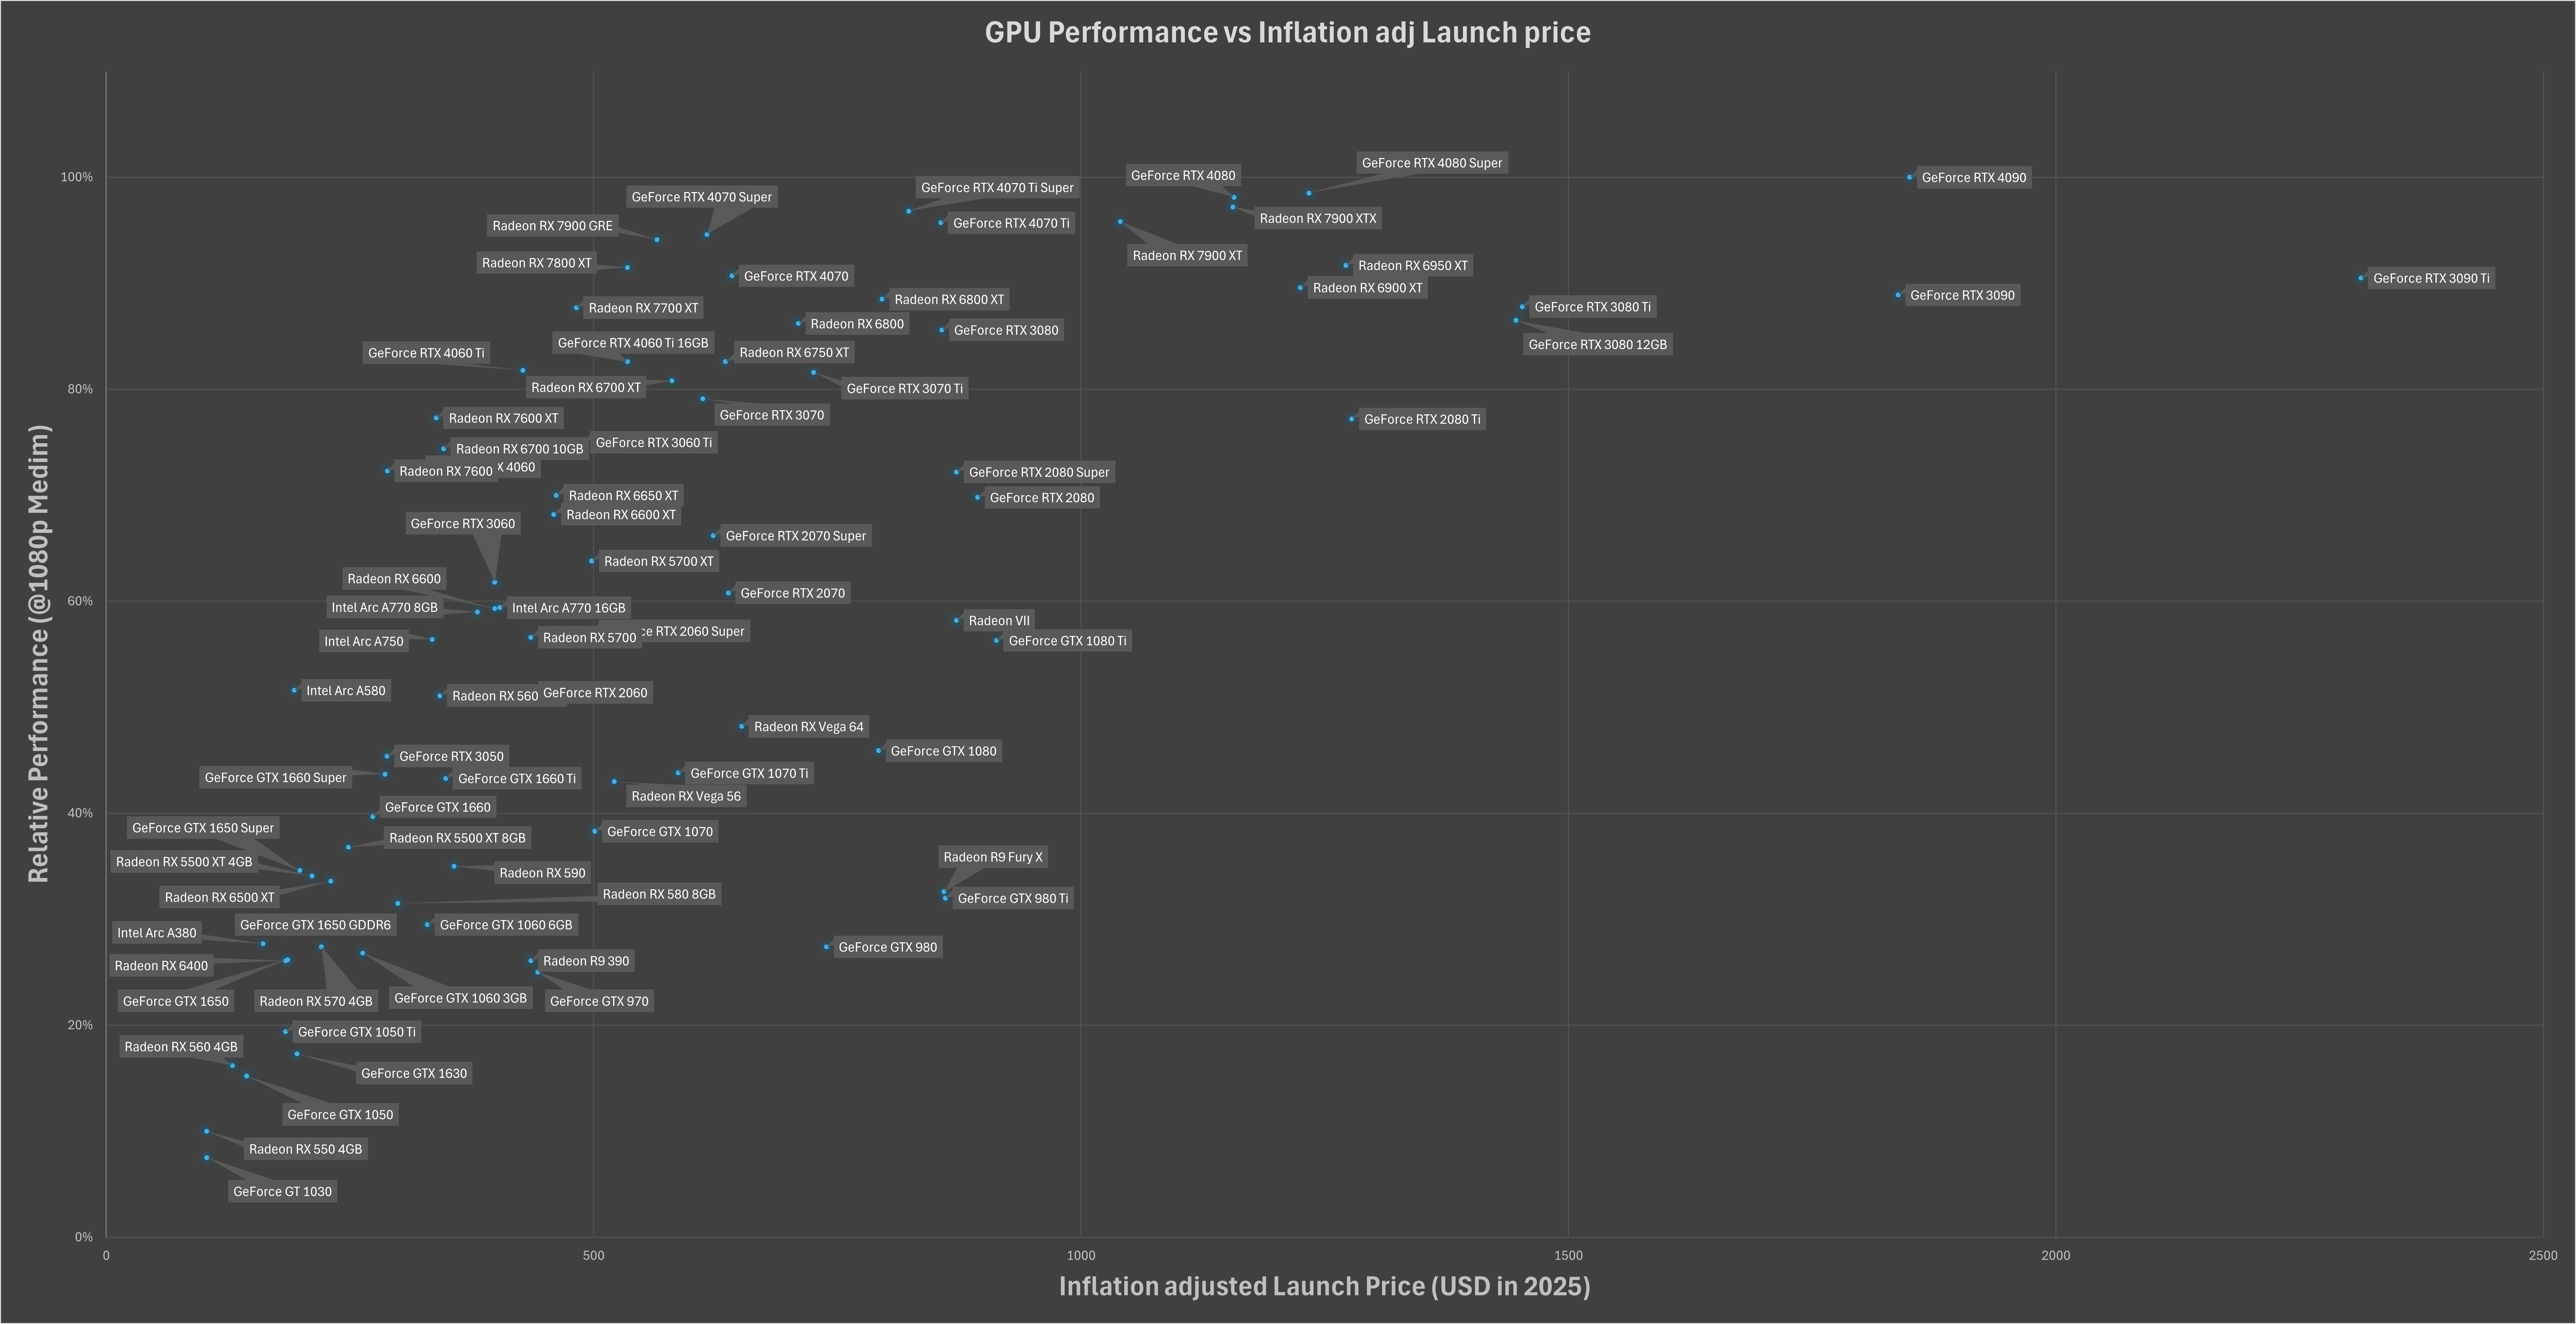
![[OC] GPU Performance vs. Inflation-Adjusted Prices: A Look at Value Over Time](https://www.europesays.com/wp-content/uploads/2025/02/565rqzwmu3ke1-1920x1024.png)
21 comments
Inspired by some of the chart from yesterday, I plotted GPU performance (Relative 1080p medium settings – data from Tom’s Hardware) against their inflation-adjusted launch prices (from the Bureau of Labor Statistics)
**High-end GPUs** like the RTX 4090 and 3090 Ti dominate performance but come with massive price tags.
**Diminishing returns** are clear at the top end—spending more doesn’t always mean significantly better performance.
here is all of my raw (and not pretty at all) data;
[https://docs.google.com/spreadsheets/d/1aCCedmz67MPvvTNhOw4JdduilxstxvoL_c3D8h6FAtA/edit?usp=sharing](https://docs.google.com/spreadsheets/d/1aCCedmz67MPvvTNhOw4JdduilxstxvoL_c3D8h6FAtA/edit?usp=sharing)
This is awesome. Got a 1070 in 2016. Nice to see that it was relatively speaking, at the time, a price to performance king. Still running it today.
EDIT: Need a 3d plot with 3rd axis by launch date haha
~~Illegibility is hardly beautiful. More pixels required.~~
Edit: My bad…as noted by Merisuola, this is apparently just a phone app issue with a larger graphic. I’d not encountered it before. Downvoting to bury my error.
I wish this was easier to read because the information it is presenting is good.
Could you make a similar chart for 4k? The top GPUs are CPU bottleneck at 1080p
Very interesting data, however I would have expected the axes to be flipped (performance in X, price in Y), maybe just me though.
Relative performance to what? The 4090? This doesn’t show what I think people believe it is showing. It’s basically a timeline as it is presented here.
You probably want uplift over previous generation.
Source: Make power point slides for a living.
So basically the best quality -price option is amd 7800XT
It’s missing the titan x pascal which is a pretty important card. It was the first pascal architecture titan, came out August 2016 at $1,200 and was beat to shit by the 1080ti on value/performance a few months later. The 5080 I got for $1,000 is a fucking bargain compared to the titan I got day one in 2016.
“Over time”
Provides absolutely no dates on any of the data points
How did we end up with a worse launch than covid era? Unmitigated rampant, relentless greed.
This tells us nothing, and the data set it’s analysing (1080p medium performance) isn’t even **relevant** for a lot of these cards.
You aren’t running 1080p medium on a 3070, let alone a 4090.
Always thought both versions of the 3090 were ridiculously overpriced
Is this price MSRP at launch? The last 4 generations of NVidia were paper launches and dont reflect the true price.
I’m wondering where you sourced your numbers, they don’t appear to be accurate, eg here’s techpowerup’s chart (granted there may be some settings differences, but if there wasn’t a CPU bottleneck i’d expect this sort of difference):
https://preview.redd.it/mxstu3fp44ke1.png?width=726&format=png&auto=webp&s=b28d7290d582c3098db37c346c6e947db722572c
All this is showing is that if you are a 1080p gamer (such as I), you should go for 70 series cards.
This is like comparing every type of car on rough terrain only. You cannot go ahead and claim “expensive super cars are actually not that powerful” by that alone. We need 2K, 4K data too at the very least.
Misleading data here.
“1080p medium” settings is a terrible metric for this, as it massively undervalues the high end GPUs in terms of “Relative performance” due to other bottlenecks in the PC.
This graph would look vastly different at 1440p high settings or 4k medium settings.
Love my 4070 Super, gonna run this thing for years unless I win the lottery
You have the 4080 Super with a higher adjusted launch price than the regular 4080? It was $200 cheaper. Surely inflation didnt jump by that in 1 year (looking at a quick online calculator, it didnt).
You’d need to compare accross settings tbh, 1080 medium is obviously going to have diminishing returns.
Did you switch around the 4080 and 4080 Super? Price placement doesn’t really make sense.
Comments are closed.