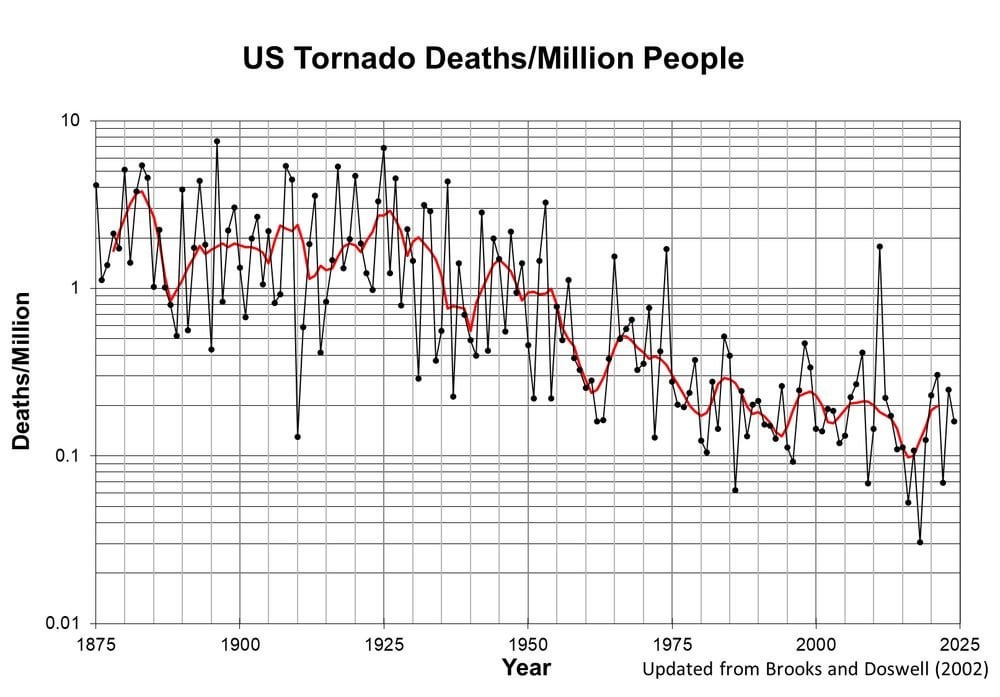
The author of the chart describes it (quoting from Bluesky):
>Now that 2024 death toll is probably final (54), here’s an update to per capita US tornado deaths. Black dots are single year, red is smoother (5-pt running mean of 3-pt median). Log-scale. Large decrease from ~1925-~1995, relatively flat before and after that. Original is now 25 years old.
Yay for science and significant government investment in forecasting systems and infrastructure.
The population growth of Tornado free zones (like Alaska and Hawaii) should not have any impact on Tornado deaths per capita…
but here we are.
How much of this is due to improvements in infrastructure, warnings, etc., and how much is due to the fact that most US population growth has occurred in areas that rarely get tornadoes?
What year was NWS founded? Or, right 1870, steady year-on-year decline. Wow, science!
Can someone explain to me why the scale is shown logarithmically?
Fake news. Stop all scientific tools that predict tornados since they cause cancer. Stop funding as it’s a waste of money…
– Trump probably
Don’t worry, we’re gonna get those numbers back up after we cut more of that “frivolous spending” and expose the widespread “fraud” among those silly, bloated agencies.
USA! USA!
/s
Read this as tomato death rate and now I want that chart
AKA Chart that proves I worry WAY too much about being killed by a tornado.
Be ready for that graph to start going to other direction. Fast. I work with people doing weather and climate prediction. They’re already talking like they’ve lost their jobs.
I remember in like 2010-2015 it seemed like there was a giant earth-shattering tornado in the Great Plains every summer. Then it just sort of petered out.
Why is it on a logarithmic scale?
Knowing the precise values of each data point isn’t important, which seems to be the only utility of using the log here.. But it seems to hid the magnitude of the change over time.
How many states really have the right conditions to produce powerful tornadoes? maybe 15
News update:Trump bans Tornado warning sirens
Read that as Toronto and thought the Canucks have been having a hard time of it.
16 comments
The author of the chart describes it (quoting from Bluesky):
>Now that 2024 death toll is probably final (54), here’s an update to per capita US tornado deaths. Black dots are single year, red is smoother (5-pt running mean of 3-pt median). Log-scale. Large decrease from ~1925-~1995, relatively flat before and after that. Original is now 25 years old.
Yay for science and significant government investment in forecasting systems and infrastructure.
The population growth of Tornado free zones (like Alaska and Hawaii) should not have any impact on Tornado deaths per capita…
but here we are.
How much of this is due to improvements in infrastructure, warnings, etc., and how much is due to the fact that most US population growth has occurred in areas that rarely get tornadoes?
What year was NWS founded? Or, right 1870, steady year-on-year decline. Wow, science!
Can someone explain to me why the scale is shown logarithmically?
Fake news. Stop all scientific tools that predict tornados since they cause cancer. Stop funding as it’s a waste of money…
– Trump probably
Don’t worry, we’re gonna get those numbers back up after we cut more of that “frivolous spending” and expose the widespread “fraud” among those silly, bloated agencies.
USA! USA!
/s
Read this as tomato death rate and now I want that chart
AKA Chart that proves I worry WAY too much about being killed by a tornado.
Be ready for that graph to start going to other direction. Fast. I work with people doing weather and climate prediction. They’re already talking like they’ve lost their jobs.
I remember in like 2010-2015 it seemed like there was a giant earth-shattering tornado in the Great Plains every summer. Then it just sort of petered out.
Why is it on a logarithmic scale?
Knowing the precise values of each data point isn’t important, which seems to be the only utility of using the log here.. But it seems to hid the magnitude of the change over time.
How many states really have the right conditions to produce powerful tornadoes? maybe 15
News update:Trump bans Tornado warning sirens
Read that as Toronto and thought the Canucks have been having a hard time of it.
Comments are closed.