Two distinct quasi-equilibrium preindustrial climate states are simulated, with and without ocean biology (hereafter referred to as REF and Abiotic, respectively; see Methods and Supplementary Table 1). Key climate metrics and carbon budget estimates for these two preindustrial states are summarized in Table 1. The Abiotic ocean releases roughly 730 Pg C to the atmosphere during the 2000-year spin-up period (Supplementary Fig.┬Ā1). Of this, 345 Pg C is adsorbed by land, primarily through CO2 fertilization-induced vegetation growth16. The remainder stays in the atmosphere, leading to a 163 ppm higher CO2 concentration (445 ppm) compared to REF (282 ppm). This increases global mean surface temperature by 1.64ŌĆē┬░C, while sea surface temperature (SST) increases by 1.15ŌĆē┬░C. This warming leads to considerable impacts on the Earth system, such as reducing Atlantic Meridional Overturning Circulation (AMOC) strength (9%) and sea-ice area in the Arctic and Antarctic (23 and 24%, respectively; Table 1). Changes in sea-ice extent are seasonally non-uniform, with September Arctic sea-ice reducing the most, by more than half. Without ocean biology, global ocean temperature increases from 3.56 to 4.66ŌĆē┬░C, and as the surface ocean equilibrates with the higher atmospheric CO2 concentration, its Revelle factor increases by 16%.
The spatial patterns of surface temperature in the two preindustrial climate states are similar but warmer everywhere in the Abiotic (Supplementary Fig.┬Ā2a, b). The Abiotic ocean exhibits stronger CO2 outgassing in the tropical oceans and ingassing in the mid-to-high latitudes (Supplementary Fig.┬Ā2d, e). The zonal outgassing band along the Southern Ocean circumpolar fronts seen in REF, associated with the upwelling of remineralized carbon-rich watermasses17, switches into a net sink in Abiotic. In the subtropical oligotrophic, the rates of CO2 flux are relatively similar in REF and Abiotic. The altered land carbon budget includes an increased vegetation carbon pool, with the largest increase simulated in the tropics region, followed by high-latitude ecosystems in the northern hemisphere (Supplementary Fig.┬Ā2g, h).
The stronger and expanded tropical outgassing in the Abiotic is consistent with (i) an absence of biological consumption of surface DIC and (ii) warming-induced lower CO2 solubility, both of which increase surface pCO2. In the high latitudes, stronger uptakes can be explained by the amplification of the seasonal cycle. Supplementary Fig.┬Ā3 illustrates that the removal of ocean biology fundamentally alters the seasonal cycle of the surface carbonate system. Firstly, the thermal-driven pCO2 variability is amplified due to higher background pCO218 and higher SST seasonal variation. Secondly, the lack of summer productivity and winter upwelling of remineralized carbon-rich deep water amplify the thermally driven pCO2 variability. Thirdly, the indirect effect of land biosphere changes (stronger summer productivity and winter respiration) leads to an amplification of the atmospheric CO2 seasonal cycle (Supplementary Fig.┬Ā3a,d). These three effects combine to increase the air-sea pCO2 gradient, with a stronger effect during winter, and manifest in a stronger high-latitude carbon sink in the Abiotic ocean (with up to a three-fold increase; Supplementary Fig.┬Ā3c, f). We note that in our quasi-equilibrium preindustrial Abiotic ocean, the sedimentary carbon content is reduced by 391 Pg C (Table┬Ā1), due to the absence of organic matter accumulations and dissolution of organic materials. This additional DIC to the water column could contribute to the overall oceanic carbon release. We also note that our experiment represents an extreme hypothetical case with a complete absence of marine productivity. When we consider a 10% reduction in primary production, a range projected by models19, Supplementary Fig.┬Ā4 shows that the preindustrial atmospheric CO2 would approximately be 10 ppm higher, while the land carbon budget increases by 9 Pg┬ĀC, implying ocean outgassing of approximately 30 Pg┬ĀC.
Historical and future projections
Projections of historical and future climate (1850ŌĆō2100) show accelerated climate change in Abiotic relative to REF (Fig.┬Ā1 and Supplementary Fig.┬Ā5). Atmospheric CO2 in REF grows from 281 to 415 (SSP1-2.6), 569 (SSP2-4.5), and 1061 (SSP5-8.5) ppm by 2100 (Fig.┬Ā1a and Supplementary Fig.┬Ā5a), consistent with the CO2 pathways defined in the CMIP6 (Coupled Model Intercomparison Project phase 6) protocol15. In the Abiotic, CO2 increases from 445 to 685 (SSP1-2.6), 883 (SSP2-4.5), and 1433 (SSP5-8.5) ppm. The stronger CO2 increase in the Abiotic (by 106, 150, and 208 ppm in SSP1-2.6, SSP2-4.5, and SSP5-8.5, respectively) is caused by the land and ocean carbon sinks diminishing by as much as 91% (i.e., land sink in SSP2-4.5). The weaker ocean carbon sink, despite higher atmospheric CO2, is attributed to the higher surface ocean pCO2 and lower air-sea pCO2 disequilibrium (Fig.┬Ā1f). Figure┬Ā2 summarizes that without ocean biology, 68 to 83% of the fossil fuel emissions would remain in the atmosphere by 2100, as compared to only 37 to 65% in simulations that include ocean biology.
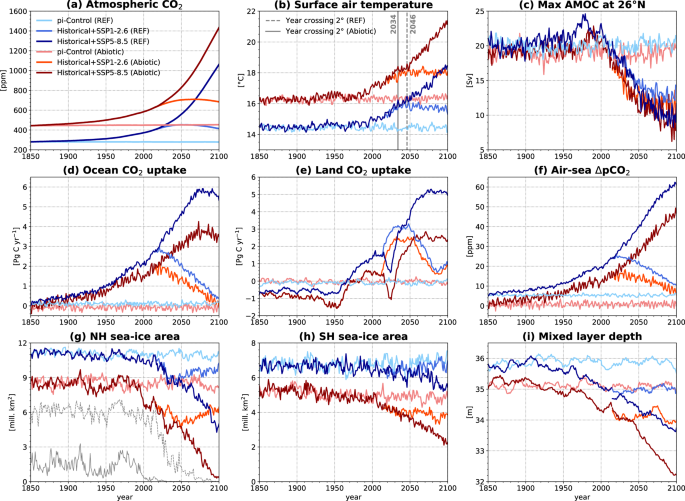
Time-series of the global annual mean (a) atmospheric CO2 concentrations, (b) surface air temperatures, (c), Atlantic Meridional Overturning Circulation strengths, (d) ocean CO2 uptakes, (e) 10-yr running mean of land CO2 uptakes, (f) air-sea ╬öpCO2, (g) northern hemisphere sea-ice area, (h) southern hemisphere sea-ice area, and (i) ocean mixed layer depths for REF (blue-lines) and Abiotic (red-lines) NorESM2-LM simulations under pre-industrial control, historical, SSP1-2.6 and SSP5-8.5 scenarios. Respective values for SSP2-4.5 are shown in Supplementary Fig.┬Ā5. Solid (dashed) gray lines in panel (g) depict the September sea-ice area in the Abiotic (REF) experiment under the historical and SSP5-8.5 scenarios.
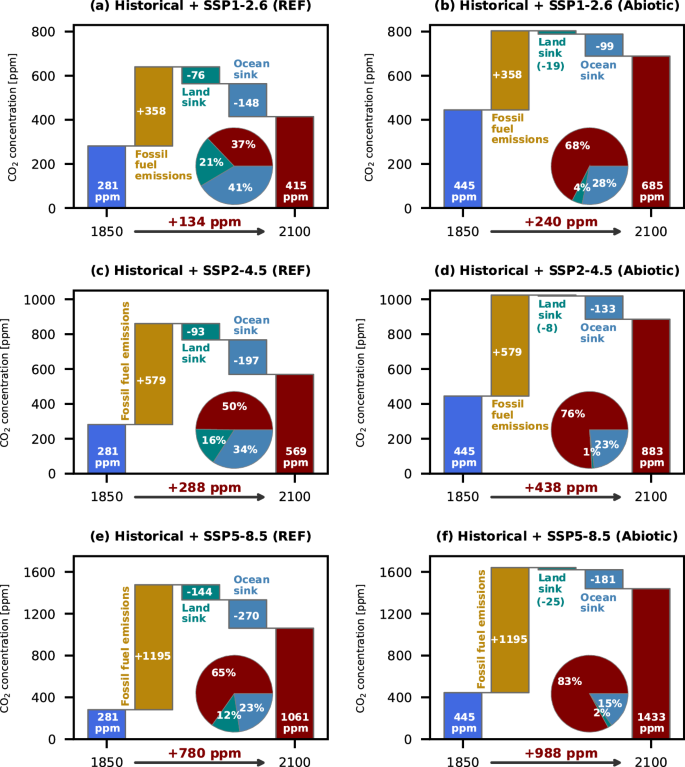
Shown are the initial CO2 concentration at the start of the historical period (dark blue), cumulative release of fossil fuel emissions (yellow), net land sink (including land-use changes, green), net ocean sink (light blue), and the final CO2 concentration at the end of the 21st century (red) in [ppm] units. The pie charts depict fractions [in percentage] of fossil fuel emissions taken up by the land, ocean, and atmosphere. Values are from REF and Abiotic simulations for (a, b) historicalŌĆē+ŌĆēSSP1-2.6, (c, d) historicalŌĆē+ŌĆēSSP2-4.5, and (e, f) historicalŌĆē+ŌĆēSSP5-8.5 scenarios.
These larger anthropogenic CO2 residuals being stored in the atmosphere translate to a stronger climate sensitivity by accelerating climate change in Abiotic, with broad implications for various components of the Earth system (Fig.┬Ā1 and Supplementary Fig.┬Ā5). Under SSP5-8.5, the global mean surface temperature in Abiotic increases by nearly 5ŌĆē┬░C by 2100, a 30% stronger warming rate than in REF (Table┬Ā1). Regionally, the largest warming occurs at high latitudes, with approximately 2┬Ā┬░C additional warming in the Arctic due to polar amplification20 (Supplementary Fig.┬Ā6). Similarly, the AMOC strength, the sea-ice area, and the ocean mixed layer depth, are projected to decline faster in Abiotic (Fig.┬Ā1c, gŌĆōi). A complete removal of ocean biology leads to the system crossing the 2ŌĆē┬░C warming threshold more than ten years earlier, with the disappearance of summer Arctic sea ice occurring more than 50 years earlier (Fig.┬Ā1b, g). This accelerated climate change is also evident in the lower emissions scenarios of SSP1-2.6 and SSP2-4.5 (Supplementary Table 2). The transient climate response to CO2 emissions (TCRE) for the REF and Abiotic are 1.69 and 2.13ŌĆē┬░C Eg CŌłÆ1, respectively (Supplementary Fig.┬Ā7), implying a 20% reduction of the allowable CO2 emissions for a specified global warming target when ocean biology is removed.
The reduced terrestrial carbon sinks in the Abiotic reflects the saturation of land carbon uptake in a warmer, higher CO2 world due to the higher preindustrial vegetation carbon pool21,22 (Fig.┬Ā1e and Table┬Ā1), hence weakening the negative terrestrial carbon cycle feedback associated with CO2 fertilization. In the ocean, warmer and higher surface pCO2 reduces seawater CO2 solubility and buffering capacity23, leading to a lower air-sea pCO2 disequilibrium and less CO2 uptake for a given increase in atmospheric CO2 concentration (Fig.┬Ā1d, f and Table┬Ā1). The lack of ocean production-induced pCO2 deficit, which has significant impacts at higher atmospheric CO2 levels, also plays an important role24.
Next, we analyze how the spatio-temporal dynamics of the anthropogenic carbon (Cant) sink and storage in the ocean are altered by the absence of ocean biology. The cumulative ocean uptake of Cant (i.e., the difference between the transient historicalŌĆē+ŌĆēfuture and the preindustrial control simulations) over the 1850ŌĆō2100 period is spatially heterogeneous, with deep water formation regions of the North Atlantic and the Southern Ocean emerging as the most intense sink regions (Fig.┬Ā3). These key gateways for Cant sinks allow for efficient transport of Cant-rich surface water to the interior for long-term storage25,26. Stronger uptake is simulated in the high-emission SSP5-8.5 than SSP2-4.5 and┬ĀSSP1-2.6, with regions of net Cant outgassing (more prominently in Abiotic) are simulated in the subtropics, where surface Cant converges27. The Abiotic Ocean absorbs considerably less Cant than REF in the subpolar North Atlantic and parts of the Southern Ocean (Fig.┬Ā3c, f, i).
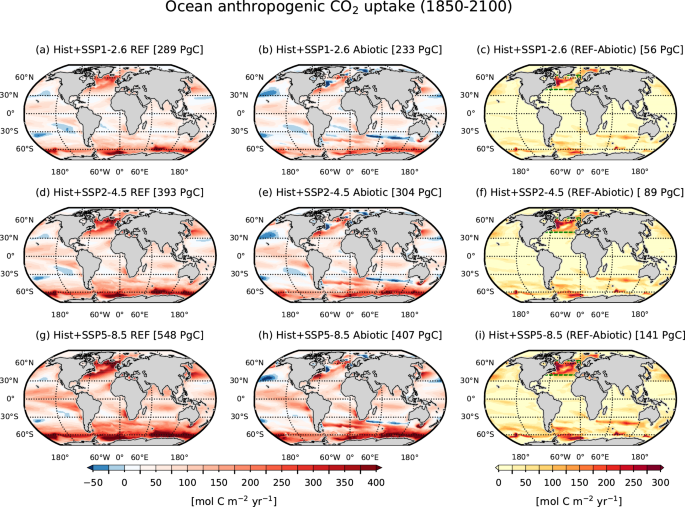
Spatial patterns of cumulative (1850ŌĆō2100) anthropogenic carbon uptake by the ocean under (a, b) historicalŌĆē+ŌĆēSSP1-2.6, (d, e) historicalŌĆē+ŌĆēSSP2-4.5, and (g, h) historicalŌĆē+ŌĆēSSP5-8.5 scenarios for REF and Abiotic simulations. Panels (c, f, i) depict differences between REF and Abiotic simulations.
We investigate the driving mechanisms of the lower Abiotic┬ĀCant uptake, focusing in the subpolar North Atlantic (dashed green outlines in Fig.┬Ā3c, f, i). Since the seasonal cycle of CO2 fluxes is fundamentally altered in Abiotic, we assess the projection of different drivers in each season (Supplementary Fig.┬Ā8). The air-sea gradient of pCO2 determines to first order the direction of CO2 flux. In REF, the oceanic pCO2 stays below the atmospheric values, and the subpolar North Atlantic is a net CO2 sink all year, consistent with observations and models28. This is also seen in the Abiotic at the beginning of the historical period but is progressively altered by the faster oceanic pCO2 growth rate, resulting in a remarkable decline in the CO2 sink. More importantly, under SSP5-8.5 (and other scenarios) oceanic pCO2 grows faster than atmospheric pCO2 during spring and summer, therefore switching from┬Āuptake to outgassing. This is primarily driven by the combination of stronger warming and the higher initial surface Revelle factor, which reduce the Abiotic ocean capacity to offset the growing atmospheric pCO2 (Supplementary Fig.┬Ā9), as depicted by the weaker surface DIC growth rate (Supplementary Fig.┬Ā8).