In 2023, the Office of Inspectors General (OIG) conducted audits of the Social Security Administration’s Numident (Numerical Identification System) finding 18.9 million records of numberholders over the age of 100 whose records lacked death dates. Established mechanisms were in place to essentially ignore these records when processing benefits, and in fact only 44,000 of those numberholders were receiving SSA payments at the time of the audit. Also, US Census Bureau estimated approximately 86,000 individuals residing in the United States were age 100 or older.
This chart simply shows the populations over time of the age cohorts stipulated in the OIG report, from the data when Social Security Numbers were first assigned (1935) to 2025. According to the SSA history website, annotations provide relevant technological improvements.
There are likely many reasons for the missing death date information, including that many of the oldest beneficiaries of Social Security died before modernizations. Plus, their records in the Numident endured a near-century of technological advancements: from handwritten paper ledgers, to typewritten forms, to punch cards, to fully automated digital systems.
Data was aggregated in MacOS Numbers from various US Census decennial surveys (with assist from GovInfo documents). A CSV was then imported to R with ggplot to SVG device which was then refined in Adobe Illustrator.
While definitely aesthetically pleasing something about it this makes it wildly hard for me to comprehend. I could just be dumb though that might be on me
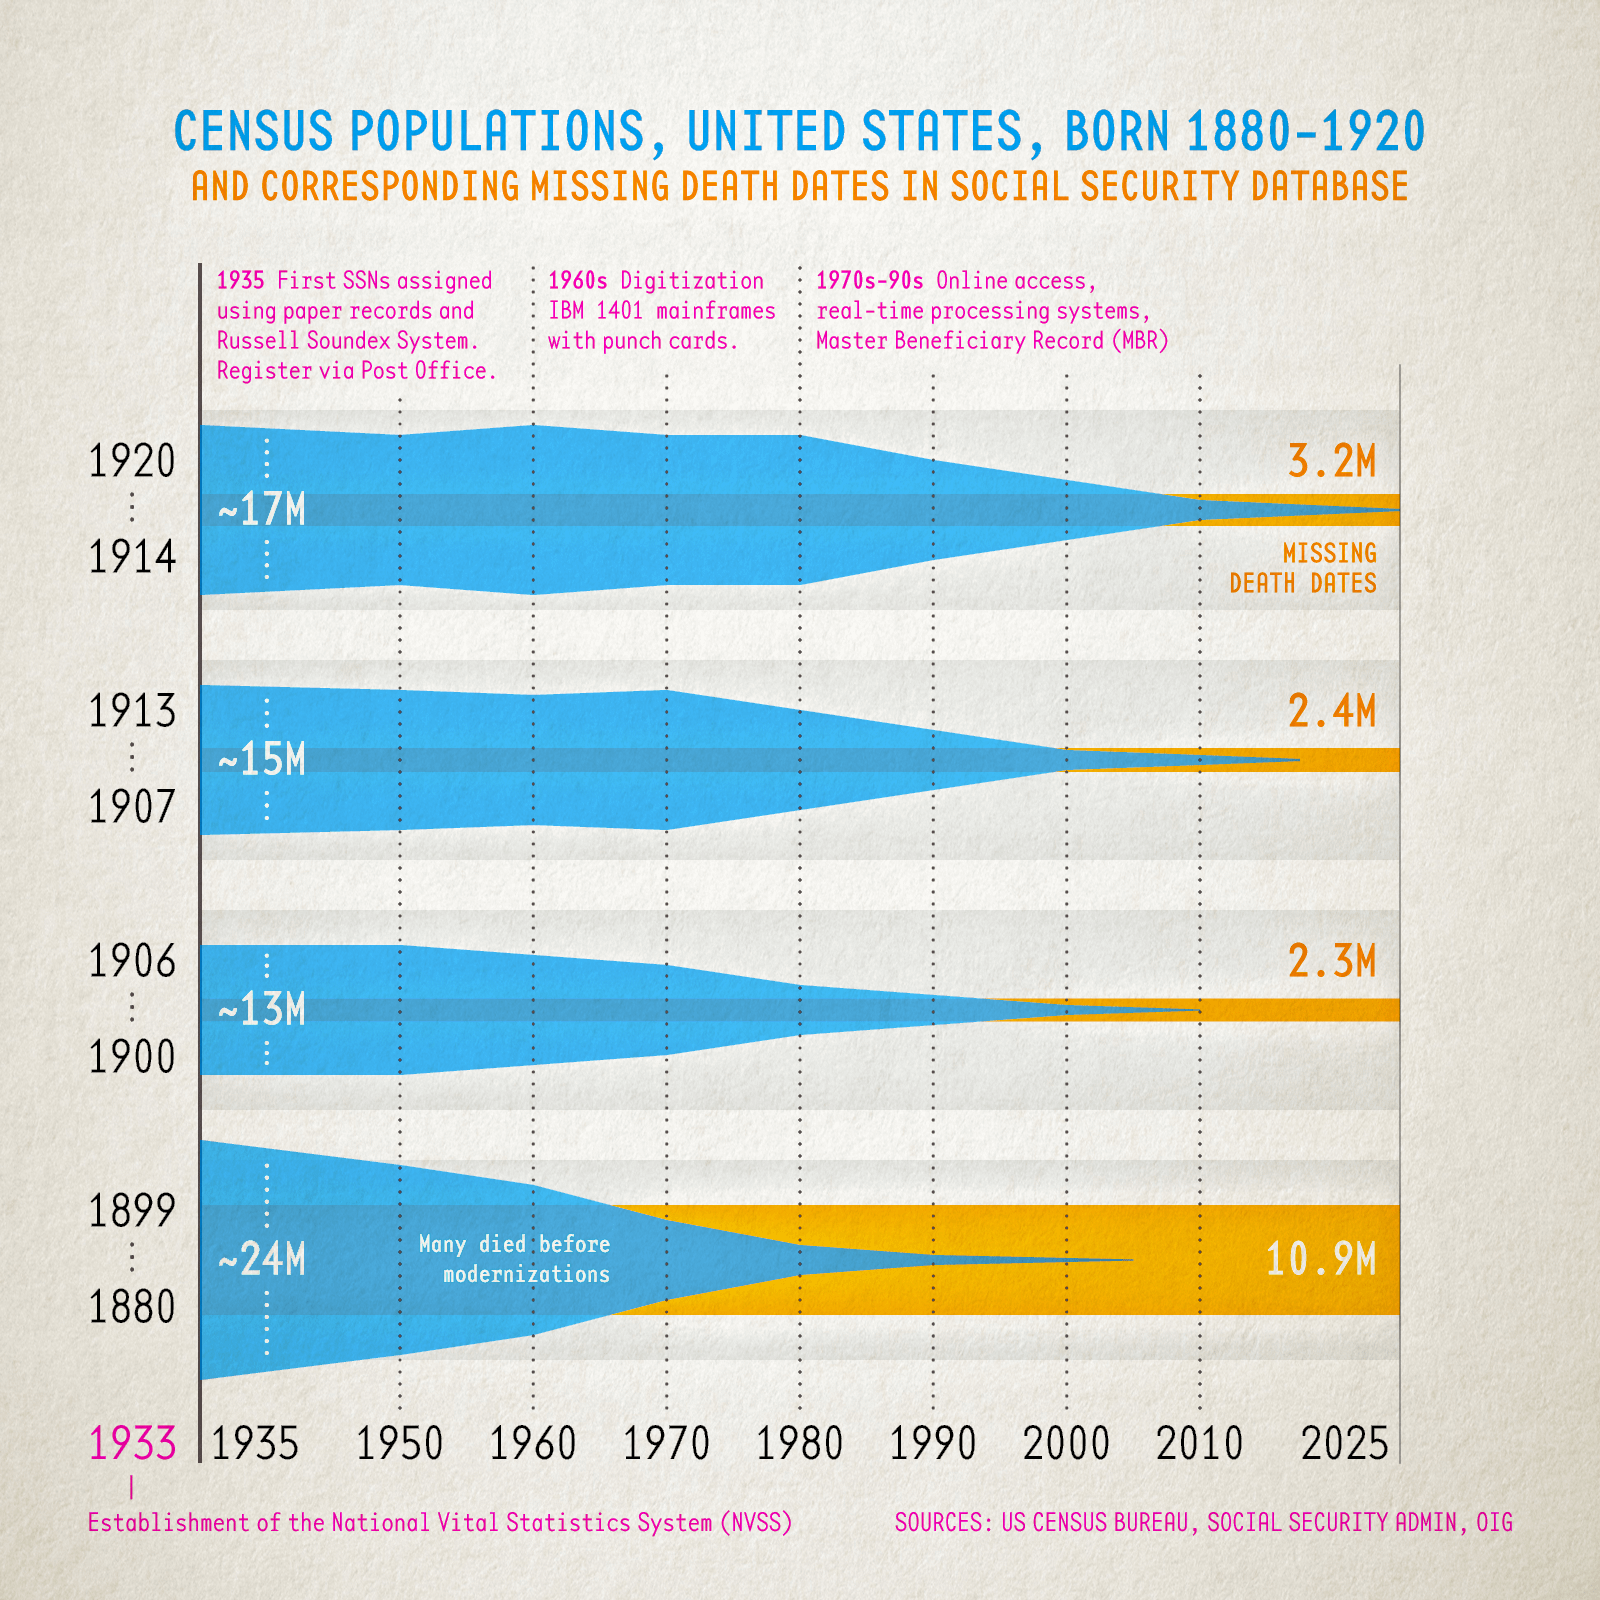
![[OC] Population of Cohorts associated with Missing Death Dates on the Numident](https://www.europesays.com/wp-content/uploads/2025/03/gvigft6fr4ne1-1600x1024.png)
3 comments
In 2023, the Office of Inspectors General (OIG) conducted audits of the Social Security Administration’s Numident (Numerical Identification System) finding 18.9 million records of numberholders over the age of 100 whose records lacked death dates. Established mechanisms were in place to essentially ignore these records when processing benefits, and in fact only 44,000 of those numberholders were receiving SSA payments at the time of the audit. Also, US Census Bureau estimated approximately 86,000 individuals residing in the United States were age 100 or older.
This chart simply shows the populations over time of the age cohorts stipulated in the OIG report, from the data when Social Security Numbers were first assigned (1935) to 2025. According to the SSA history website, annotations provide relevant technological improvements.
There are likely many reasons for the missing death date information, including that many of the oldest beneficiaries of Social Security died before modernizations. Plus, their records in the Numident endured a near-century of technological advancements: from handwritten paper ledgers, to typewritten forms, to punch cards, to fully automated digital systems.
Data was aggregated in MacOS Numbers from various US Census decennial surveys (with assist from GovInfo documents). A CSV was then imported to R with ggplot to SVG device which was then refined in Adobe Illustrator.
Social Security History:
https://www.ssa.gov/history/
2023 Audit: Office Of Inspectors General
Numberholders without Death Information on the Numident
https://oig.ssa.gov/assets/uploads/a-06-21-51022.pdf
US Census raw surveys:
https://www2.census.gov/programs-surveys/popest/
US Government Publishing Office (for older numbers):
https://www.govinfo.gov/
Data, US Census, decennial-based estimates, in Millions:
|COHORT |1940|1950|1960|1970|1980|1990|2000|2010 |OIG |
|———|—-|—-|—-|—-|—-|—-|—-|——|—-|
|1920-1914|17 |15 |17 |15 |15 |10 |6 |2 |3.2 |
|1913-1907|15 |14 |13 |14 |10 |6 |2 |0.1 |2.4 |
|1906-1900|13 |13 |11 |9 |5 |3 |1 |0.001 |2.3 |
|1880-1899|24 |19 |15 |8 |3 |1 |0.05|0.0005|10.9|
very interesting, thank you for your research
While definitely aesthetically pleasing something about it this makes it wildly hard for me to comprehend. I could just be dumb though that might be on me
Comments are closed.