Source(s): US Treasury Department, Office of Management and Budget, Federal Reserve Bank of St. Louis, Census Bureau (population adjustments)
Tool: Custom
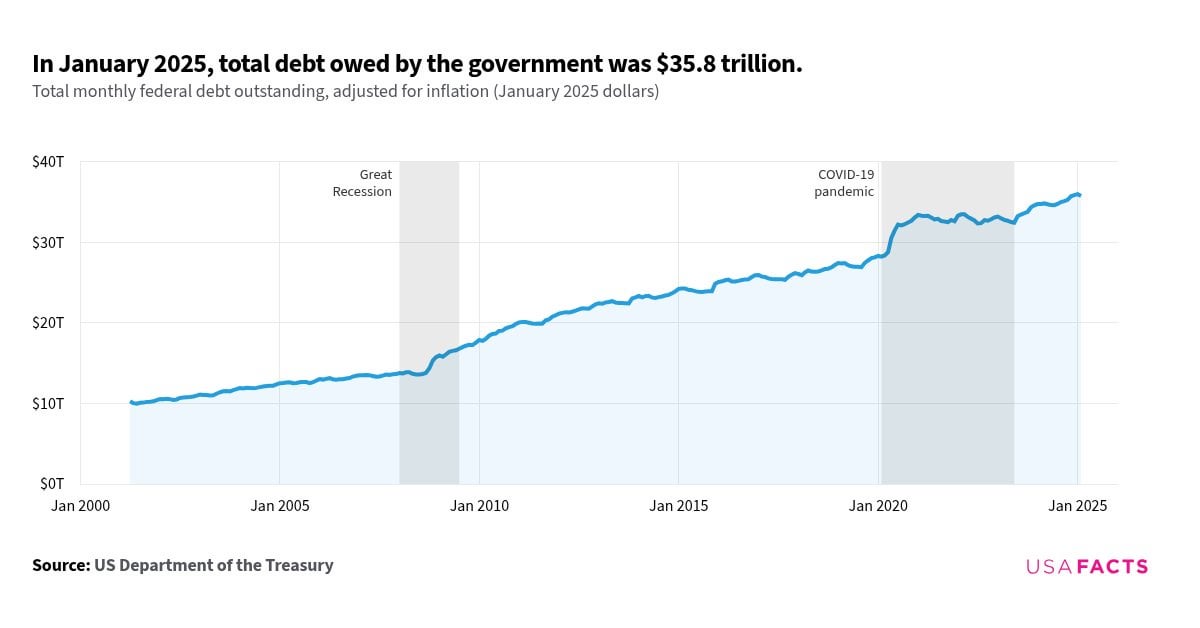
The last federal budget surplus happened in FY 2001. Since then, regular deficits have led to a rising national debt.
* The US national debt reached $35.8 trillion in January 2025, marking a 3% increase from the previous year and a 31% rise compared to 2019, before the COVID-19 pandemic.
* On a per-person basis, this translates to roughly $106,000 per American—an amount that’s grown about 5% annually since 2001.
* Currently, US debt sits at 133% of GDP. It surpassed 100% in 2012.
* Interest payments on this debt accounted for 10.7% of government spending in FY 2023.
Up and up it goes….yikes.
The important measure is how much of the GDP is spent on interest payments. Taxes as a % of GDP has dropped from 28% to 25% (2000-2023). Interest payments are still reasonably low at 10% (it was around 7% before covid). Even though federal debt is crazy high, the interest rates were nearly 0% after 2008. If that money can be spent in a productive way, then it’s worth borrowing as much as possible.
What policy changes occurred post Covid that caused it to level off? I would have thought the Covid spending would have had it continuously increasing.
Also what caused it to pick up again at the end?
I’m so sick and tired of people not fucking understanding how government debt works man.
“Governments are monopoly suppliers of risk-free treasury securities. In contrast to households, which are assumed to be price-takers, government debt-management policies have firstorder implications for the interest rate. We show that an increase in government debt can, under plausible parameterizations of the economy, cause a drop in the real interest rate. As a consequence, the fiscal authority can run an active policy that ignores the level of debt when determining the path of the primary fiscal deficit.2 To make this point formally, we use a twogeneration overlapping generations model. The key to our result is that the agents who hold government debt are distinct from those who repay it through higher taxes.3”
“Macroeconomists are used to making arguments in the context of the representative agent model where the agent is the only counterparty to government borrowing. In this framework the demand for bonds is infinitely interest elastic and the real interest rate cannot adjust to stabilize government debt.9 By relying too heavily on this stylized representation, economists have perpetuated the household fallacy. We have shown in this note that the household fallacy is a feature of the infinitely-lived representative agent model that does nnot extend to more realistic demographics.”
Stop spreading this stupid fallacy without understanding what the federal debt even means.
What are the odds we go full Modern Monetary Theory, stop issuing debt, and just start printing money when the government wants to buy or build stuff?
7 comments
Source(s): US Treasury Department, Office of Management and Budget, Federal Reserve Bank of St. Louis, Census Bureau (population adjustments)
Tool: Custom
The last federal budget surplus happened in FY 2001. Since then, regular deficits have led to a rising national debt.
* The US national debt reached $35.8 trillion in January 2025, marking a 3% increase from the previous year and a 31% rise compared to 2019, before the COVID-19 pandemic.
* On a per-person basis, this translates to roughly $106,000 per American—an amount that’s grown about 5% annually since 2001.
* Currently, US debt sits at 133% of GDP. It surpassed 100% in 2012.
* Interest payments on this debt accounted for 10.7% of government spending in FY 2023.
Up and up it goes….yikes.
The important measure is how much of the GDP is spent on interest payments. Taxes as a % of GDP has dropped from 28% to 25% (2000-2023). Interest payments are still reasonably low at 10% (it was around 7% before covid). Even though federal debt is crazy high, the interest rates were nearly 0% after 2008. If that money can be spent in a productive way, then it’s worth borrowing as much as possible.
What policy changes occurred post Covid that caused it to level off? I would have thought the Covid spending would have had it continuously increasing.
Also what caused it to pick up again at the end?
I’m so sick and tired of people not fucking understanding how government debt works man.
“Governments are monopoly suppliers of risk-free treasury securities. In contrast to households, which are assumed to be price-takers, government debt-management policies have firstorder implications for the interest rate. We show that an increase in government debt can, under plausible parameterizations of the economy, cause a drop in the real interest rate. As a consequence, the fiscal authority can run an active policy that ignores the level of debt when determining the path of the primary fiscal deficit.2 To make this point formally, we use a twogeneration overlapping generations model. The key to our result is that the agents who hold government debt are distinct from those who repay it through higher taxes.3”
“Macroeconomists are used to making arguments in the context of the representative agent model where the agent is the only counterparty to government borrowing. In this framework the demand for bonds is infinitely interest elastic and the real interest rate cannot adjust to stabilize government debt.9 By relying too heavily on this stylized representation, economists have perpetuated the household fallacy. We have shown in this note that the household fallacy is a feature of the infinitely-lived representative agent model that does nnot extend to more realistic demographics.”
Stop spreading this stupid fallacy without understanding what the federal debt even means.
What are the odds we go full Modern Monetary Theory, stop issuing debt, and just start printing money when the government wants to buy or build stuff?
Comments are closed.