We use output from the pre-industrial control (PI-control) run of the Community Earth System Model version 2 (CESM2), as well as output from the first 10 ensemble members of the CESM2 Large Ensemble Community Project (LENS2)13. CESM2-LENS2 simulations cover the time period of 1850-2100, using historical forcing and SSP370 future radiative forcing, following CMIP6 protocol14. CESM2-LENS2 is run at a nominal 1° horizontal resolution, which is inadequate to properly resolve the most intense TCs15. Thus, we use the open-source TC downscaling model of Lin et al. (2023)16 to downscale CESM2-LENS2 and generate a large event set of synthetic TCs (Methods). On a high level, the downscaling model works by randomly seeding weak vortices in space and time, evolving their track using the beta-and-advection model17, and simulating their intensity using a statistical-physical intensity model18. We also downscale the ERA5 reanalysis from 1979–202319 to benchmark with observations (Methods). We focus on the boreal summer TC season, though our methods can be easily applied to the Austral TC season.
To diagnose the ENSO state and magnitude, we use the July-August-September-October (JASO) averaged Niño3.4 index20 (“Methods”). We also use the JASO-averaged east minus west (E-W) index to quantify the equatorial zonal SST gradient6 (“Methods”). This index measures the SST difference between the equatorial eastern and western Pacific, and is highly correlated with Niño-3.4 in both HadISST (r = 0.90) and the CESM2 PI-control runs (r = 0.78). The E-W index is computed with respect to the E-W index climatology over the PI-control run.
In this study, we focus on wind hazards at a fixed point in space. While this can be estimated by resolving the full wind field of each synthetic TC and interpolating the TC-induced wind hazard at each fixed point, it is not straightforward to compare the modeled wind hazard with observations. Instead, we follow21, estimating the return period of local TC wind hazard by obtaining the intensity of all storms that pass within 100 km of a particular point of interest. This method allows for an easier comparison between models and observations, as TC intensity is better observed than point-wise wind speed. However, evaluating local TC hazards requires a large sample set, and thus this approach depends heavily on the computationally inexpensive TC downscaling model. We use the USA best-track estimates of intensity in the IBTrACS observational dataset (1979–2023) to benchmark the model’s estimates of TC wind hazard22.
The influence of internal variability on tropical cyclone hazard
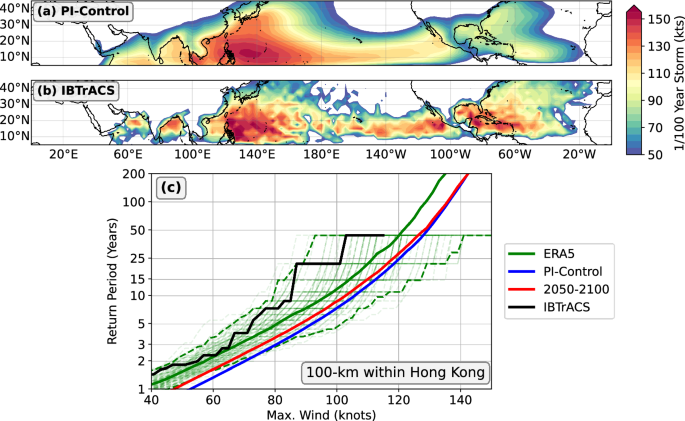
To begin, we first qualitatively compare TC hazard, as represented among the downscaled events in CESM2-PI, with that estimated from the observations. Figure 1a, shows the intensity of the 1-in-100-year storm in the CESM2 PI-control period, while the intensity of the strongest storm within 100-km of a point in IBTrACS is shown in Fig. 1b. The overall structure of observed TC hazard is qualitatively reproduced by the CESM2 PI-control downscaling, though there is a negative bias in the Atlantic and Eastern Pacific basins.
a Intensity of the 1-in-100-year storm among the downscaled TCs in CESM2 PI-control. b Intensity of the strongest storm within 100 km of a point from IBTrACS. c Return period curve for the maximum intensity of TCs that pass within 100 km of Hong Kong, calculated through (green) downscaling ERA5 from 1979–2022, (blue) downscaling the 1000-year CESM2 PI-control simulation, (red) downscaling 10 members of CESM2-LENS2 from 2050–2100, and (black) IBTrACS observations. The light green lines indicate sub-sampling of the ERA5 downscaling event set to the same sample size as IBTrACS, with dashed-green lines indicating the 95% confidence interval.
Next, we turn to our metric of local TC hazard and show that the downscaling model can reasonably reproduce local TC hazard as estimated from the observations. Figure 1c shows the return period curve for the maximum intensity of TCs that pass within 100 km within Hong Kong. We observe that TC wind hazard, as represented by the ERA5 downscaled tracks, is relatively similar to that estimated from IBTrACS. In order to account for sampling error in the historical events, we sub-sample the total ERA5 event set to the same size as the number of TCs in the observations, as shown in the green curves in Fig. 1c. This exercise shows that the modeled TC hazard is reasonable when considering sampling error, though the downscaling model likely has an intensity or frequency bias at Hong Kong. Finally, we compare the TC wind hazard inferred from the CESM2 PI-control downscaled tracks. The modeled TC wind hazard is slightly larger than that in ERA5, which could be owing to model biases in both the steering flow and thermodynamic environment.
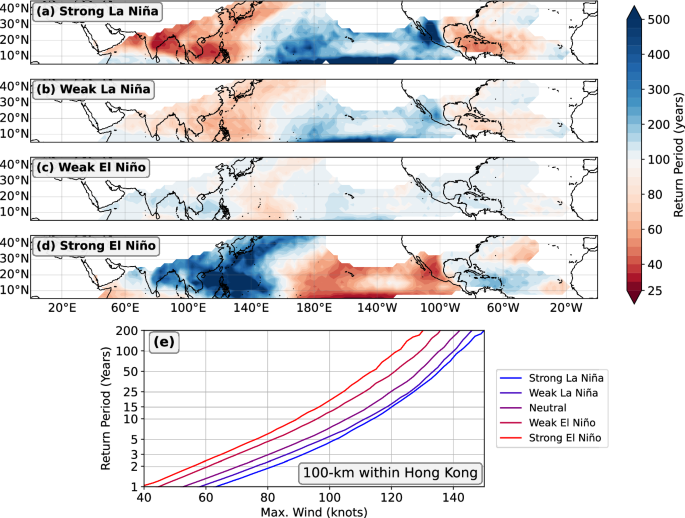
How is TC wind hazard modulated by internal variability? We henceforth focus on ENSO, as it is the most dominant tropical mode of internal variability. However, there are a few modes of natural variability that have been proposed to modulate TC behavior across the globe, such as Pacific Decadal Variability23 or the Pacific Meridional Mode24,25. However, it is infeasible to condition the local return period hazard on the phase of ENSO using historical observations or observation-based data sets (i.e., best track or reanalysis) alone, due to the small sample size of the historical observations/reanalyzes. In contrast, the 1000-year PI-control run allows us to calculate TC hazard, conditioning on the phase of ENSO, without significantly sacrificing sample size (see Methods). Figure 2a–d shows the spatial pattern of the frequency of the 1-in-100-year storm separated into ENSO states. During strong La Niña events, the hazard in the West Pacific and North Atlantic increases, and vice-versa during strong El Niño events. We observe that the downscaling model applied to the CESM2 PI-control period qualitatively reproduces the observed relationship between TC activity and ENSO8,11,26,27.
a–d The return period of a storm with the intensity of the 1-in-100-year storm, during various labeled ENSO states, among the downscaled events in CESM2-PI. Red and blue shading indicate increased and decreased hazard, respectively. e The same return period curves as Fig. 1c, except stratified by ENSO phase over the PI-control simulation, using the Niño3.4 index.
As can be inferred from Fig. 2a–d, the state of ENSO significantly modulates the local TC wind hazard. As shown in Fig. 2e, during neutral ENSO years, the 1-in-100-year storm at Hong Kong has an intensity of approximately 135-knots, while during strong La Niña events and strong El Niño events, a 135-knot storm has a return period of around 30 years and 300 years, respectively, around an order of magnitude modulation of the TC wind hazard. One caveat here is that in the downscaled tracks, the TC frequency in the West Pacific depends on the ENSO state; this relationship is not found in the observations (Fig. S6). However, only a portion of the total wind hazard modulation by ENSO is controlled by TC frequency (Fig. S1). Thus, these results are robust to model biases in the sensitivity of TC frequency to ENSO state.
These results show that ENSO, which generates SST patterns as a consequence of internal atmosphere-ocean dynamics, plays a significant role in modulating local TC hazards. Would a long-term forced trend of the tropical Pacific towards an “El Niño-like” or “La Niña-like” mean-state consequently alter future TC wind hazard similarly?
The influence of warming patterns on tropical cyclone hazard
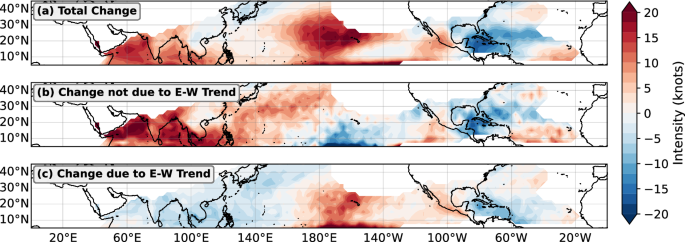
How is local TC hazard projected to change at the end of the 21st century? Figure 1c shows that at Hong Kong, the 2050–2100 TC hazard barely changes from that during pre-industrial conditions. This result is not unique to Hong Kong–the total hazard is modeled to decrease in many regions with global warming (Fig. 3a), despite increases in the potential intensity (Fig. S4). In our downscaling projections, there is very little change to the global TC frequency between the pre-industrial and the 2050–2100 periods (Fig. S2). Thus, at least in this model, the decrease in TC hazard in spite of global warming cannot be purely due to a decrease in TC frequency. There is, however, significant uncertainty in global frequency when one considers multiple models28,29.
It turns out that a large fraction of TC hazard change is linked to the modeled pattern of warming in the Pacific. In CESM2-LENS2, there is an “El Niño-like” trend in response to anthropogenic emissions; the SST gradient between the West and East Pacific decreases by around 1 K through 2050–2100 (Fig. S5). In order to understand how the SST pattern trend affects TC hazard projections, we decompose changes in the total future TC wind hazard, ΔHtotal, into:
$$\Delta {H}_{{\rm{total}}}=\Delta {H}_{P}+\Delta {H}_{\not P}$$
(1)
where ΔHP and ΔH/P are the hazard changes between the pre-industrial period and 2050–2100 that are, respectively, attributable, and not attributable, to changes in the equatorial Pacific zonal SST gradient. Given ΔHtotal and ΔH/P, we can infer ΔHP using Eq. (1).
We estimate ΔH/P by calculating the return period curve of TC hazard only during years where the E-W index falls under a small, fixed range of values. For example, Fig. 3b shows the spatial pattern of ΔH/P, conditioning on the E-W index range of [−0.5, 0.5], which constrains the event set to those during years where the E-W index is close to its climatological value under pre-industrial conditions. The results are not sensitive to the exact range used, as long as the range is small and sufficiently sampled in both pre-industrial and future climates (Fig. S3). We observe that ΔH/P is positive in most of the West Pacific basin, with a more complicated multi-signed pattern in the Atlantic basin.
The spatial pattern of ΔHP is shown in Fig. 3c, using Eq. (1). By construction, the pattern of ΔHP bears a strong resemblance to that of El Niño (Fig. 2d), namely that the intensity of the 1-in-100-year storm reduces over the Northwest Pacific and Atlantic regions. These results suggest that the modeled Pacific SST pattern of warming induces a change to the pattern of TC hazard that strongly resembles that which is induced by El Niño. Comparing Fig. 3b and c, we also observe that ΔHP is generally around the same order of magnitude as ΔH/P. In fact, in many regions along coastal Asia, the former is larger in magnitude (and opposite in sign) than the latter. In other words, in these regions, the SST pattern effect could act to offset increases to TC hazard owing to other factors (such as a global increase in potential intensity).
Of course, the magnitude of ΔHP will depend on the strength of the trend in the equatorial zonal SST gradient, and this has a wide range across the available ensemble climate models, both over the historical period and in the future6,12,30. In addition, while the CESM2-LENS2 downscaling shows no significant change in TC frequency with warming (Fig. S2), an increase or decrease in TC frequency would respectively amplify or reduce the TC hazard change not attributable to the patterns of warming. It is also important to stress that the pattern of ΔHP (Fig. 3c) looks like an ENSO signal by construction. However, the pattern of ΔH/P (Fig. 3b) is not subject to the same constraints.
A storyline approach to future warming patterns
There is compelling evidence emerging in recent studies that shows that the “El Niño-like” pattern of warming in climate models may be incorrect5,31,32. This implies that projections of regional tropical cyclone activity may be incorrect as well. To understand how an increase in the equatorial Pacific zonal SST gradient affects near-term TC hazard, we use the storyline approach, in which one works through the detailed consequences of a specific, plausible climate trajectory without trying to estimate its probability33. We define near-term as the period between 2020–2060 and assume that the change in the storyline’s E-W index, or \({\text{EW}}^{{\prime} }\), follows the observed linear trend from 1960-2020 (≈ −0.13 K per decade), and then either (1) stops at 2020 and stays the same, or (2) continues through 2060. To construct the TC hazard response under the “La Niña-like” storyline, we assume that the TC hazard change per degree of increase in the CESM2 E-W index can be used to predict the TC hazard change per degree of decrease in the storyline E-W index. The TC hazard change in the storyline is thus obtained by normalizing ΔHp by the magnitude of the decrease in the E-W index (in the CESM2 simulations), and multiplying it by the desired storyline change in the E-W index. In other words, given a return period of n years, we take the 2060-2100 TC hazard change attributable to the E-W index (Fig. 3c, for n = 100 years), and normalize it by \(\overline{EW}\), or the 2060–2100 average value of the E-W index in CESM2-LENS2. 2060–2100 is chosen since the signal in the E-W index change is the largest in that time period (Fig. S5). The local TC hazard change that is not associated with changes in the E-W is kept the same. Thus, the total hazard change is assumed to follow the form:
$$\Delta {H}_{{\rm{total}}}(n,t)={\text{EW}}^{{\prime} }(t)\frac{\Delta {H}_{P}(n)}{\overline{EW}}+\Delta {H}_{\not P}(n,t)$$
(2)
where t is time. Note that \({\text{EW}}^{{\prime} }\) is negative (increase in the E-W temperature gradient), and \(\overline{EW}\) is positive (decrease in the E-W temperature gradient).
There are a few assumptions and limitations to this approach. First, Eq. (2) explicitly assumes linearity in the relationship between TC wind hazard and the Pacific zonal SST gradient. We also assume that TC frequency is independent of the assumed storyline. Given the large uncertainty in future TC frequency, this is the “null hypothesis” approach. The reader is referred to Methods for more details on these assumptions.
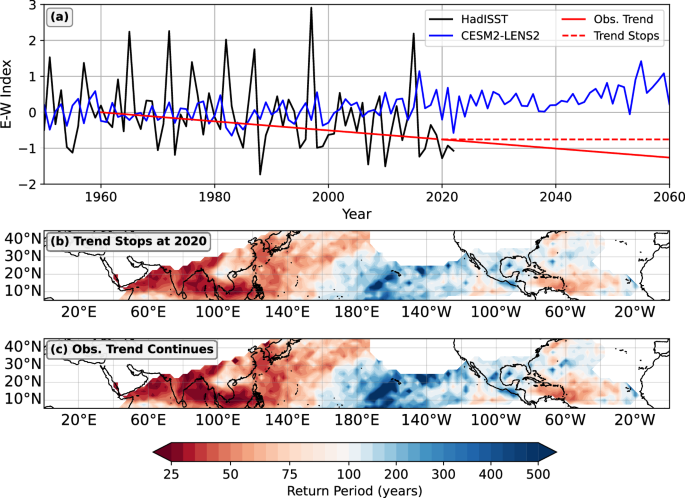
Figure 4 shows the return period of the pre-industrial 1-in-100-year storm in 2020–2060, under the two scenarios. If the observed E-W trend stops at 2020, the 1-in-100-year storm becomes the 1-in-50-year storm over much of coastal Asia. For example, the 1-in-100-year storm is estimated to return approximately every 55 years at Manila, Philippines—nearly a 2-fold increase in the hazard from pre-industrial conditions. In contrast, the Atlantic basin has more of a mixed signal, as ΔHP owing to a “La Niña-like” trend is opposite-signed of ΔH/P. If the trend further continues through 2060, our estimates show that in some locations, the 1-in-100-year storm during pre-industrial conditions could return as frequently as every 25 years. At Manila, the continuation of the E-W trend increases the frequency of the 1-in-100-year storm to every 47 years by 2060.
a Storyline scenario where the observed (1960-2020) trend in the E-W index (dashed-red) continues through 2060, and (red) stops at 2060. b, c Return period of a storm with the intensity of the 1-in-100-year storm during pre-industrial conditions, assuming the observed La Niña-like trend (b) stops at 2020 and (c) continues through 2060. Red shading shows increased hazard, while blue shading shows decreased hazard.


