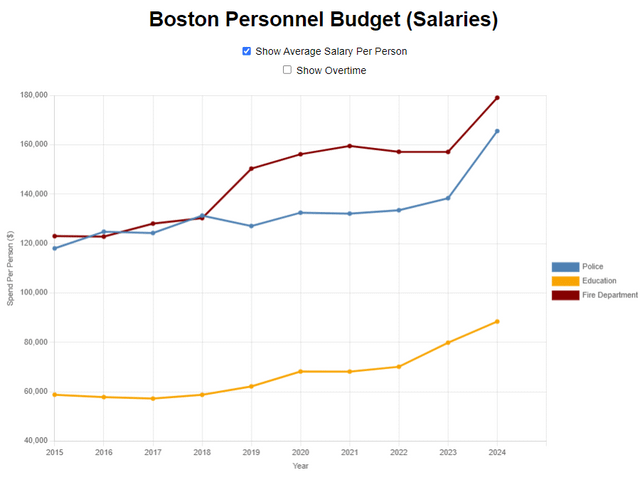
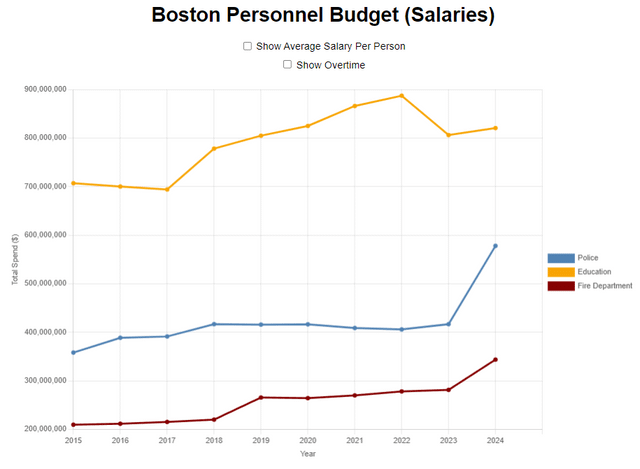
This is a follow up to the previous graphic I made about Boston crime maps. Instead of answering the question of how much crime takes place in Boston, this one answers the question of “did defund the police actually happen?” The answer is it didn’t. I thought it was also useful to compare across to other high spend departments like the fire department and education.
In the parsing of the data, education counts anyone who works at a school, using education key words in the department name to segment the data. The fire department and police department are easier to detect.
You can also see the number of workers at each data point if you use the tool itself. This can be found here: [https://jerrying123.github.io/budgets/boston.html](https://jerrying123.github.io/budgets/boston.html)
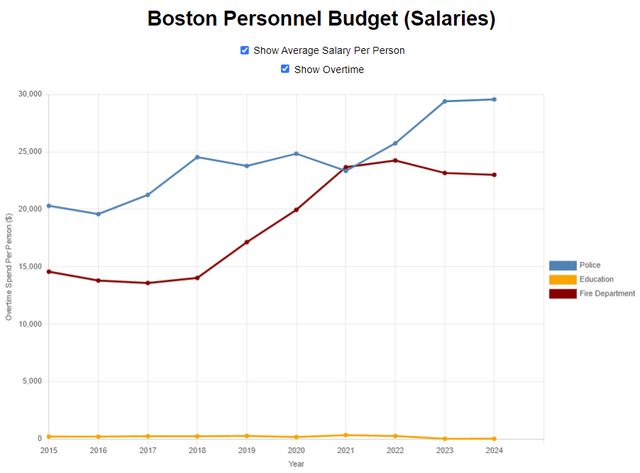
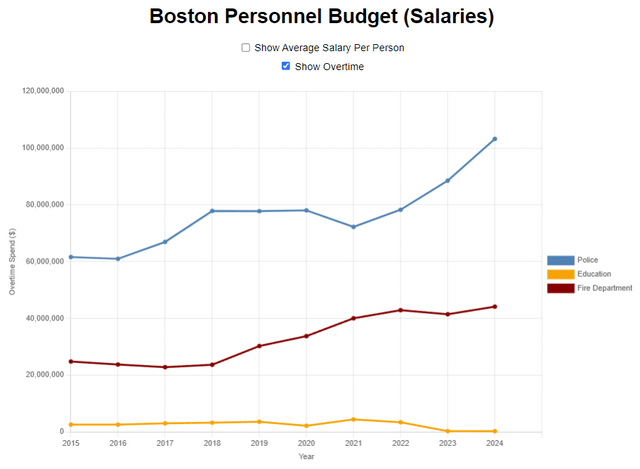
Wasn’t it found that Boston police were stealing millions of hours of overtime. Did anything happen with that?
Surely there are more departments than fire, police, and education no?
The city I work for has a dozen or so divisions with Parks & Rec generally the lowest paid and police/fire at the top end but many others land closer to the middle making this seem perhaps more stark than the actual situation.
Sorry, am I reading this right?
$160k+ for a police officer?
The UK fucking sucks. London police officers start on a salary of £38k a year, which is about $50k. Over three times less.
Don’t need schools when you’ve got prisons to fill.
8 comments
This is a follow up to the previous graphic I made about Boston crime maps. Instead of answering the question of how much crime takes place in Boston, this one answers the question of “did defund the police actually happen?” The answer is it didn’t. I thought it was also useful to compare across to other high spend departments like the fire department and education.
In the parsing of the data, education counts anyone who works at a school, using education key words in the department name to segment the data. The fire department and police department are easier to detect.
You can also see the number of workers at each data point if you use the tool itself. This can be found here: [https://jerrying123.github.io/budgets/boston.html](https://jerrying123.github.io/budgets/boston.html)
Data used can be found here: [https://data.boston.gov/dataset/employee-earnings-report](https://data.boston.gov/dataset/employee-earnings-report)
**Tools:**
ChartJS
**Hosted:**
Github Pages
What about the Dunkin’ employees?
Wasn’t it found that Boston police were stealing millions of hours of overtime. Did anything happen with that?
Surely there are more departments than fire, police, and education no?
The city I work for has a dozen or so divisions with Parks & Rec generally the lowest paid and police/fire at the top end but many others land closer to the middle making this seem perhaps more stark than the actual situation.
Sorry, am I reading this right?
$160k+ for a police officer?
The UK fucking sucks. London police officers start on a salary of £38k a year, which is about $50k. Over three times less.
Don’t need schools when you’ve got prisons to fill.
The average Boston police salary is $160000+ ??
Alright I’m signing up
Does this account for inflation?
Comments are closed.