![Proportion of Voter Preference by State in 2024, including non-voters and abstentions [OC]](https://www.europesays.com/wp-content/uploads/2025/03/4pjq6lueo2qe1-1920x1024.jpeg)
Hello,
Thank you for the early feedback on the post. I fixed some of the biggest concerns (State labels offset and voter categories). I hope you don't mind the resubmission.
From the previous post:
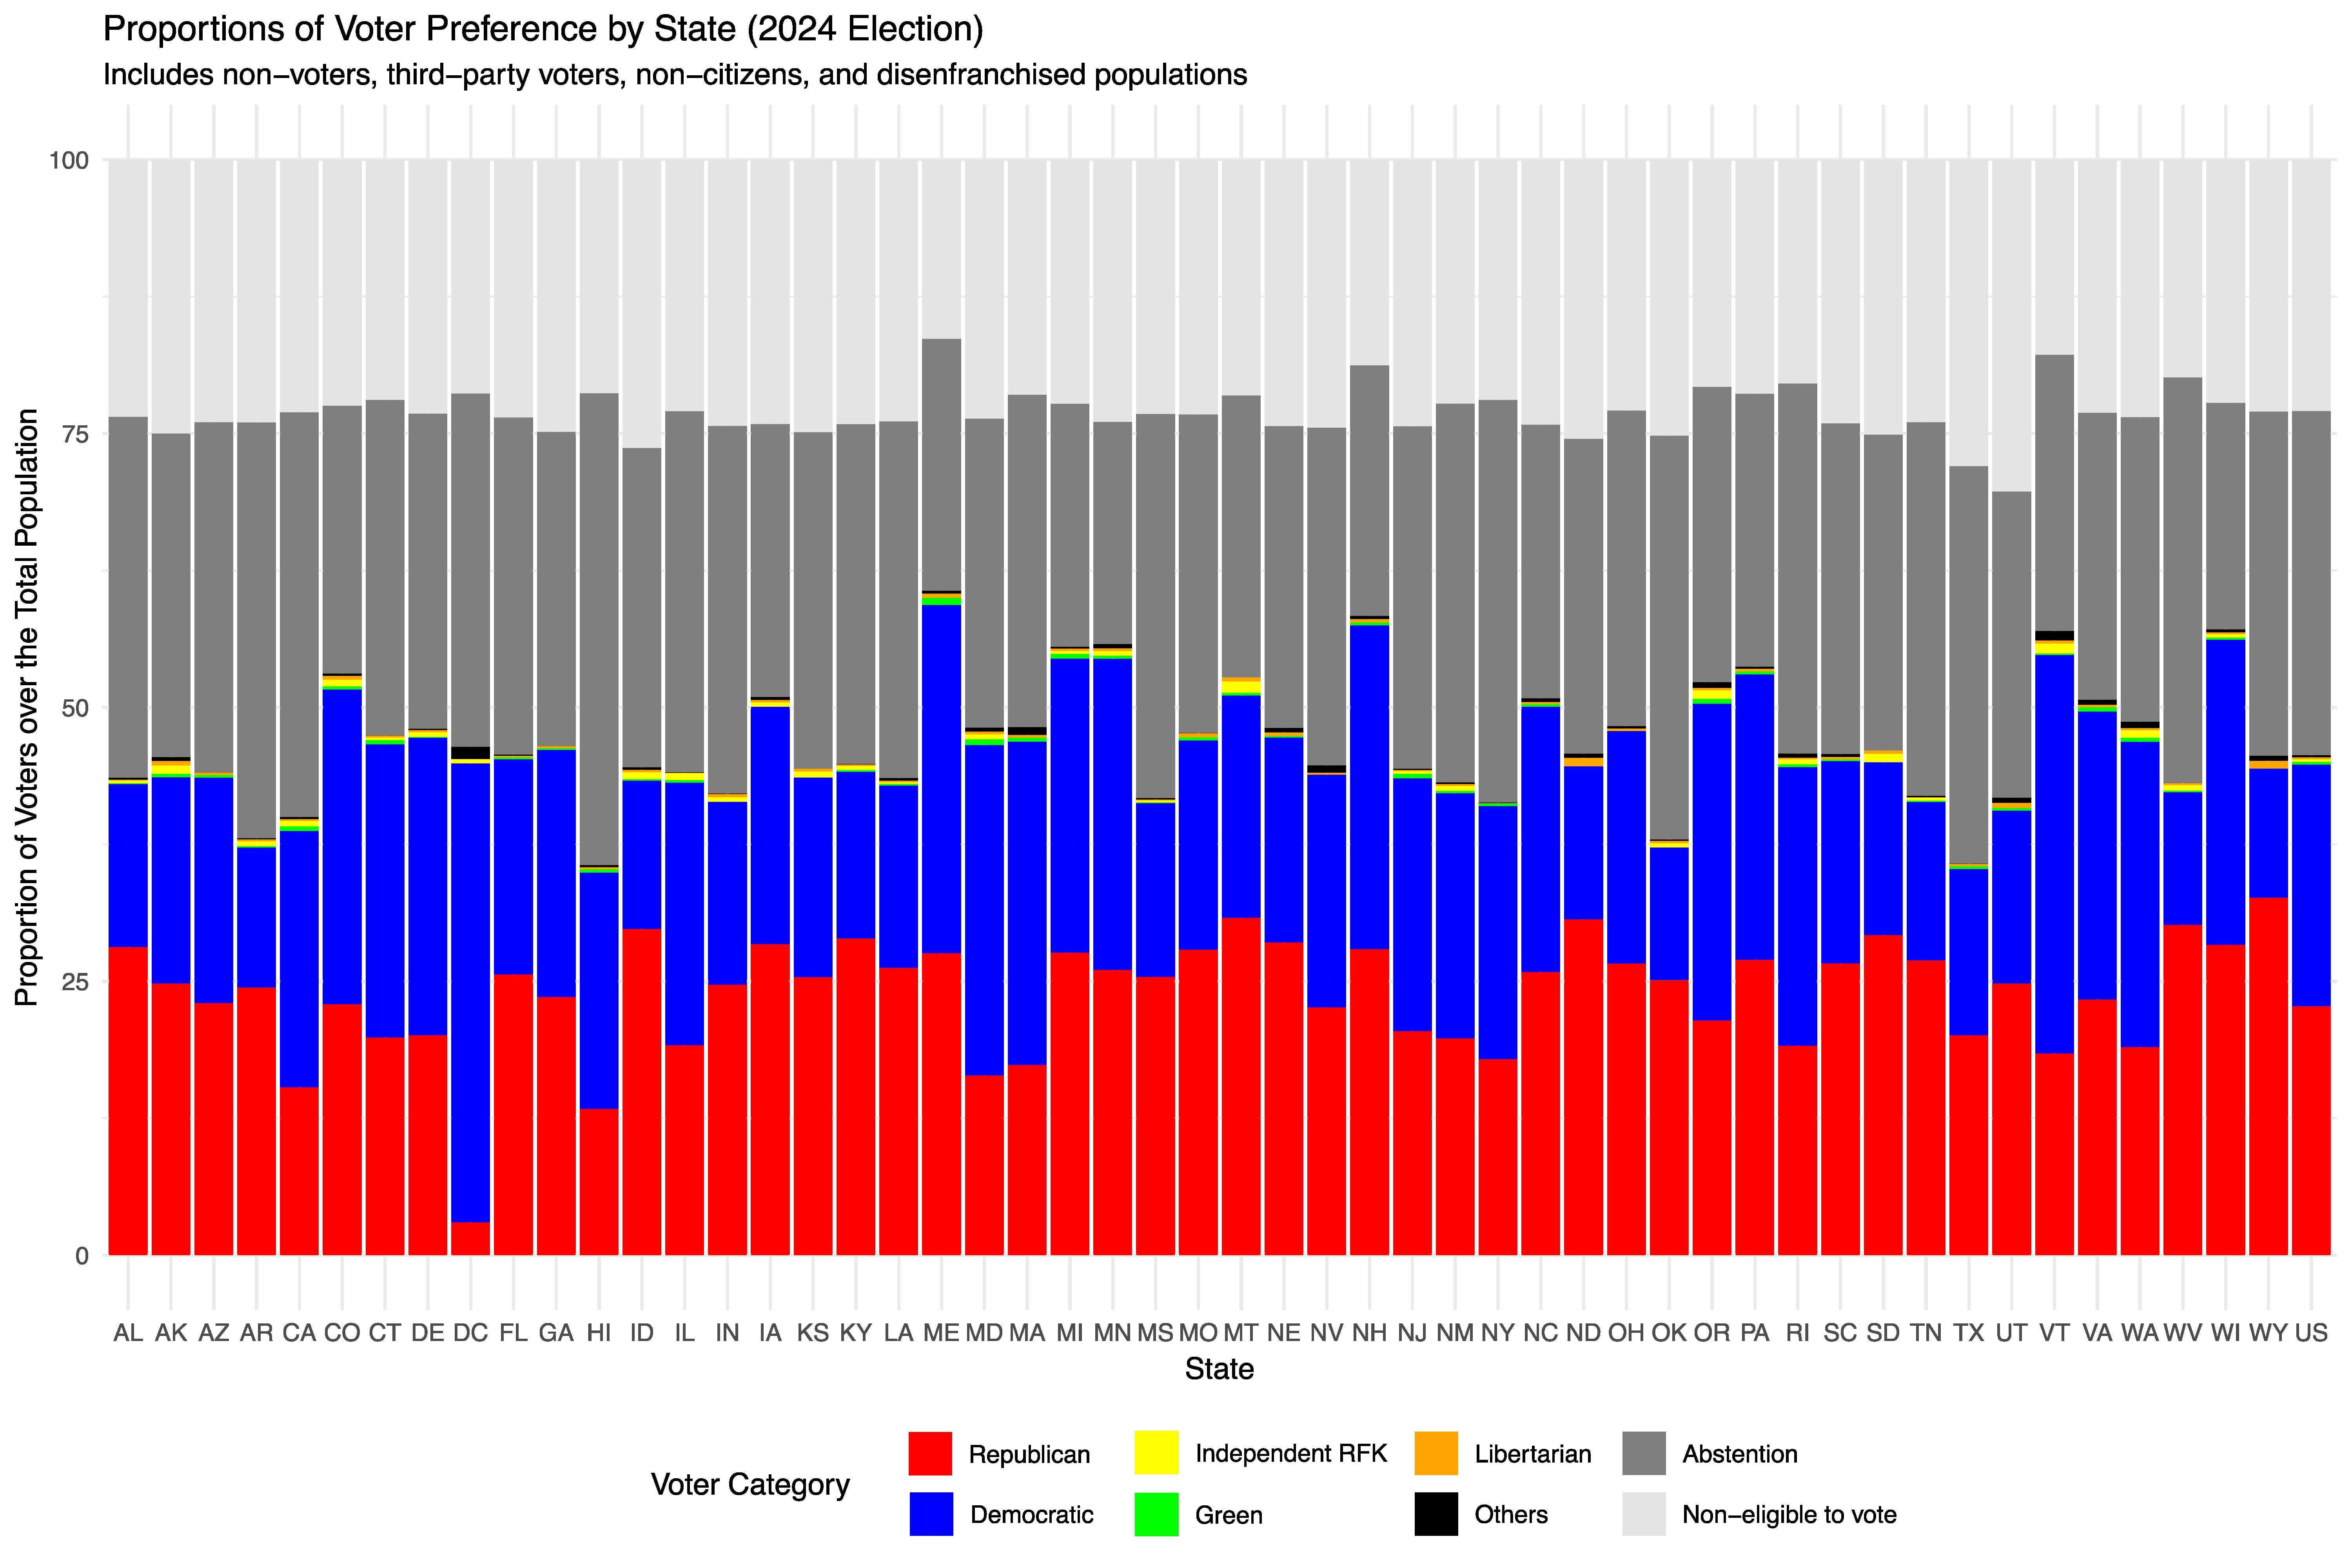
I am interested in seeing how well each US state was represented in the 2024 election, especially considering that so many people don't vote (people skeptical of the system) or can't vote (immigrants, felons, children, etc.). It would also be great to break down the non-eligible category by minors, felons, green card holders, illegal immigrants, etc., to include groups that aren't represented. However, these categories may overlap and are difficult to quantify.
I am open to suggestions for improving this visualization.
The data source was this Wikipedia page: https://en.wikipedia.org/wiki/2024_United_States_presidential_election#Results, section Results by state. I made the plot using ggplot in R.
Political tangent (feel free to disagree): I hope this type of content leads to conversations among the public on electoral reform, particularly proportional representation, multimember districts, or the extension of voter rights to some marginalized communities, like former felons. Also, it is reassuring to see that people who voted for Trump/Vance are a minority of the total population, even in states like Wyoming or Idaho. Still, at the same time, it is discouraging to see that 25% of the total population has so much electoral power (77 million votes, out of 340 million people).
Posted by BioDataBard
4 comments
I really don’t hold with the spin of sideways counting people who chose not to (or can’t) be counted.
Less than 25% of Americans voted to for Trump, sure, but even less than that voted against Trump.
Genuinely surprised to see how low voter turnout was in Texas. Esp. since it’s such a huge State…
california abstention voters never failing to disappoint me
we have some of the easiest ways to turn in ballots in the history of the US and they ask you if you want to register to vote when you get your drivers license and if you want to register/alter your party preferences when you renew it.
i know there’s a lot of sentiment about “oh california votes blue anyways, and my one vote doesn’t do anything really” but god its so frustrating hearing that from friends and family when they assume it’s only midterms and presidential elections that matter. you don’t like our tax rate? vote. you don’t like the housing requirements? vote. you want more bike lanes or trees or whatever the hell your single interest is? vote!!!!1
This graph looks like the Russian flag
Comments are closed.