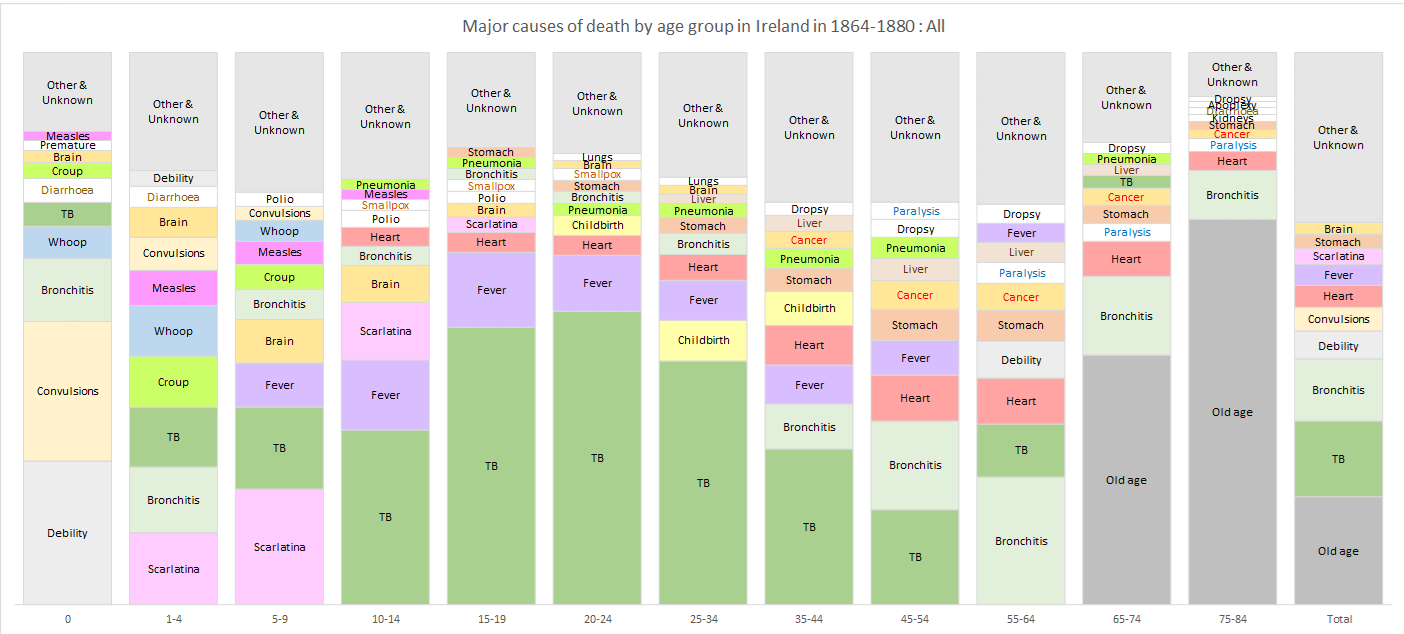
This chart shows, for each age group, the 10 largest causes of death (actually, 9 plus Other) as a %. Because there were so many different causes, I did not create a series for each, but created only 10 series, and populated the values, colours and labels programmatically in Excel.
I think the result is effective, showing how different causes dominated each age group. The high percentage of "Unknown" is mainly because many people died at home, far from medical assistance or diagnosis, and cause of death was reported by relatives. It was often vague, like fever and convulsions, or improbable, like teething. The number of different childhood causes is striking, many of which have fortunately been overcome by medical advances.
TB stands out as a major killer, particularly of young to middle age adults, devastating many developing families. I estimated it knocked about 4 years off life expectancy (which was not very high, at about 50 for men and women).
Posted by Derryogue
4 comments
The data comes from annual Government reports labelled “Causes of death in Ireland”. These can be hard to find, but I have a complete set if anyone is interested. The tool used to create the chart was Excel and VBA.
Note – TB in the chart above refers to tuberculosis, aka phthisis
TB? Do you seriously mean tuberculosis? It’s so prevalent in Ireland?
Hey antivaxxers… don’t recognise half of those causes? There’s a reason for that.
There are excellent records of the people buried in a number of Irish graveyards from that time. Mount Jerome, a large cemetery in Dublin, keeps records of who was buried there, where they lived, age, occupation and what they died of. The infant mortality was something like 25% in the 19th century and the leading cause of death listed was, “the damp”.
The records are fascinating if very grim.
Comments are closed.