Also crazy how everything got so much more expensive.
This is a really good example of why smoothing should be used very judiciously.
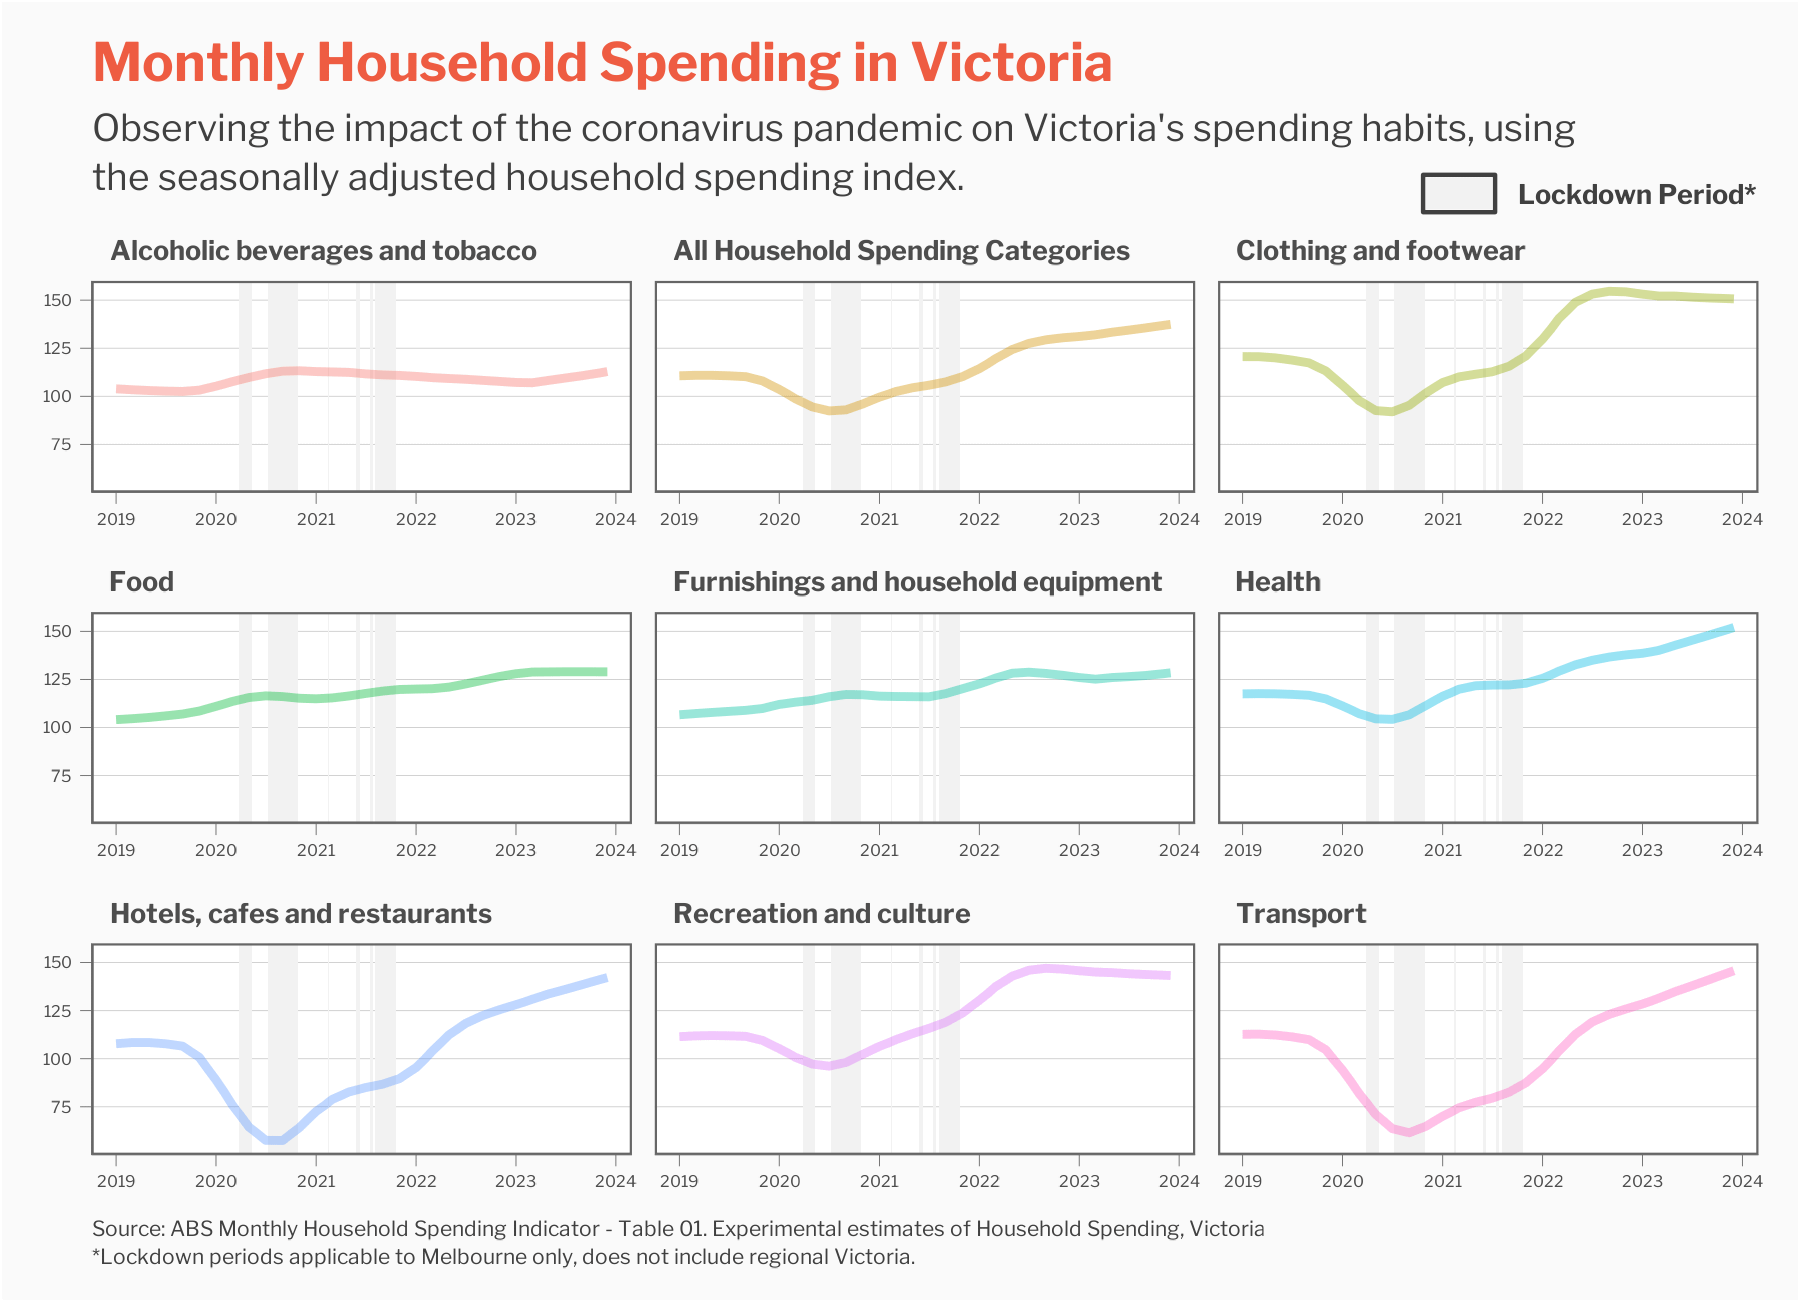
Every downward trend appears to have started in Q3 or Q4 of 2019, before COVID-19 was even a significant thing. Is that genuine, or does it look like that just because of sampling timeframes and smoothing?
![[OC] Changes in Household Spending in Victoria, Australia during the pandemic.](https://www.europesays.com/wp-content/uploads/2025/03/dvk5kvc2u0re1-1800x1024.png)
3 comments
Source: ABS: [https://www.abs.gov.au/statistics/economy/finance/monthly-household-spending-indicator/may-2024](https://www.abs.gov.au/statistics/economy/finance/monthly-household-spending-indicator/may-2024)
Created using R (ggplot2)
What does a score of 100 mean?
Also crazy how everything got so much more expensive.
This is a really good example of why smoothing should be used very judiciously.
Every downward trend appears to have started in Q3 or Q4 of 2019, before COVID-19 was even a significant thing. Is that genuine, or does it look like that just because of sampling timeframes and smoothing?
Comments are closed.