![[OC] U.S. Presidential Election Results as Percentage of Voter-Eligible Population, 1976-2024](https://www.europesays.com/wp-content/uploads/2025/04/7rgvs23bleve1-1920x1024.png)
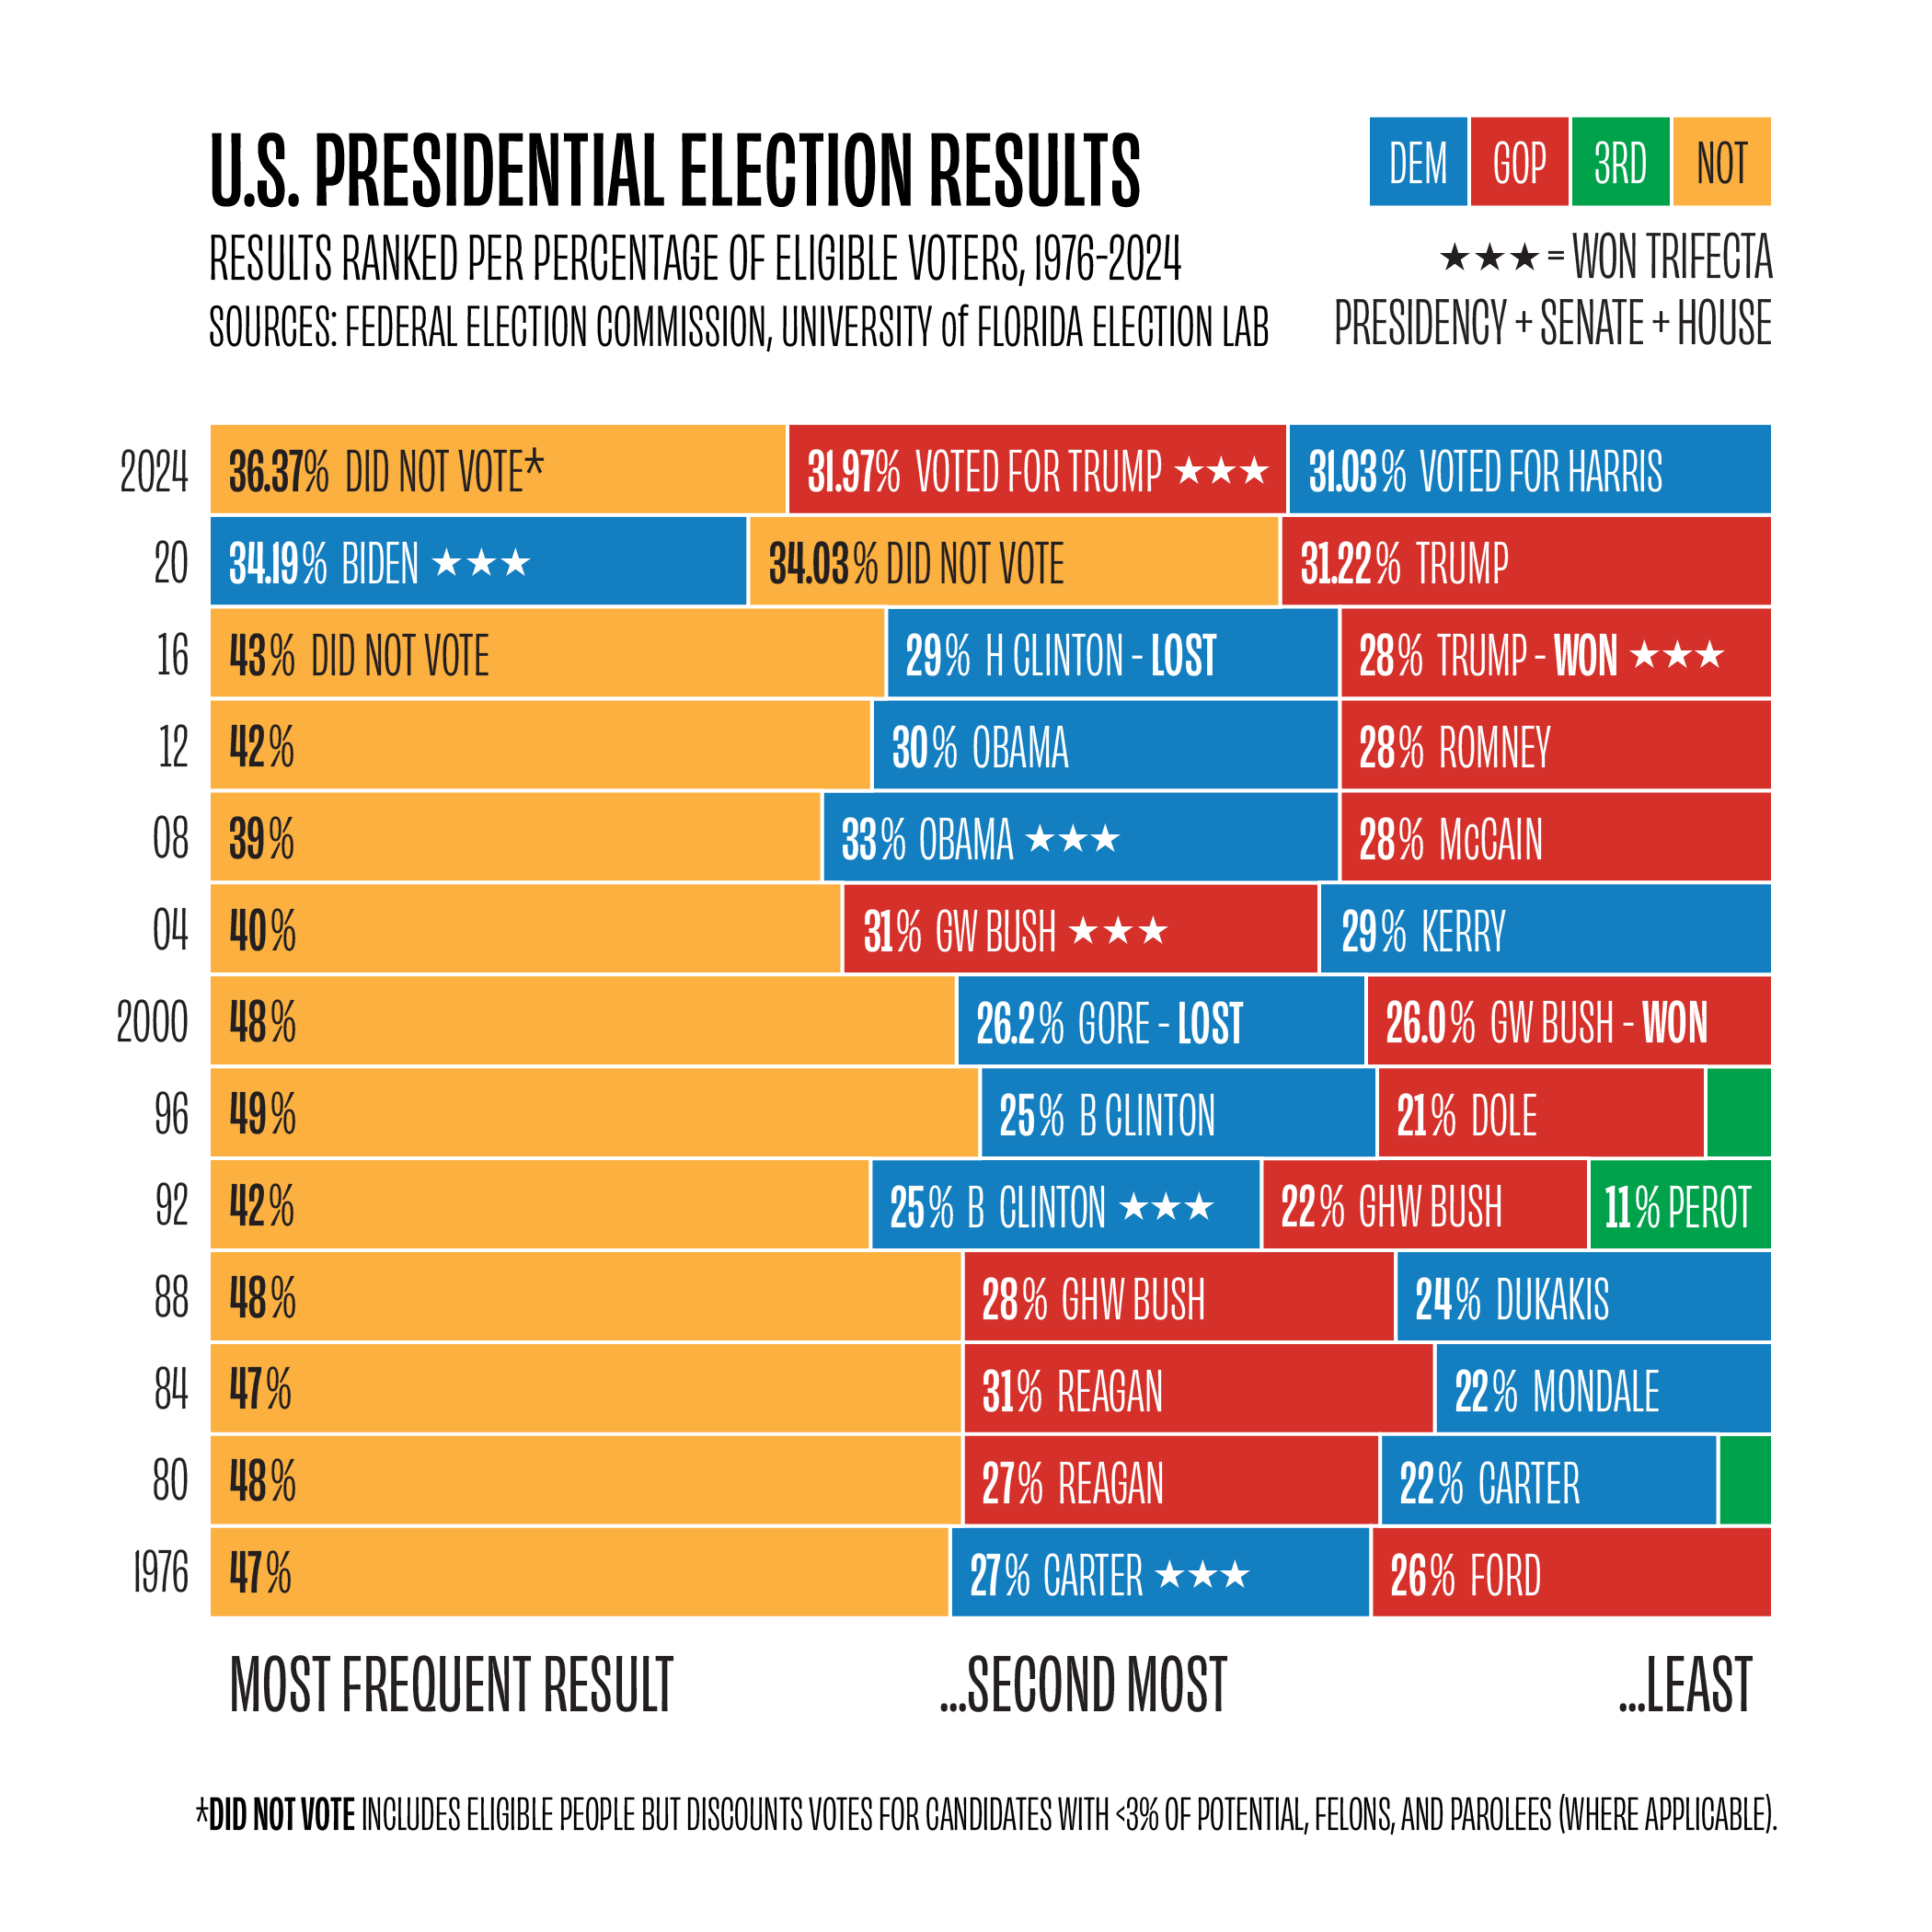
Update of previous post. U.S. Presidential election results, including all eligible people who did not vote. Employs voter turnout estimates to determine an estimated population of eligible voters, then calculates election results (including "Did Not Vote" and discounting "Other" votes of little consequence) as a percentage of that. Proportions were rounded to thousandths (tenths of a percent) and reflect minor discrepancies due to rounding in reported voter turnout and vote share data.
2024 Results as of April 17, 2025 https://www.fec.gov/introduction-campaign-finance/election-results-and-voting-information/
University of Florida Election Lab (UFEL) https://election.lab.ufl.edu/2024-general-election-turnout/
- Voting Eligible Population: 244,666,890 (VEP, UFEL)
- Ballots counted: 156,733,610 (UFEL, 64.06% turnout)
- Non-voters: 87,933,280 (UFEL, 35.94% inverse of turnout)
- Donald Trump: 77,302,580 (FEC)
- Kamala Harris: 75,017,613 (FEC)
- Other: 2,898,484 (FEC, explicitly cast for a candidate)
- Base: 241,768,406 (=VEP-Other)
Results in the following percentages (discounting Other):
- Donald Trump: 31.97%
- Kamala Harris: 31.03%
- Non-voters: 36.37%
NOTE This chart tries to strike a balance between simplicity and apparent accuracy. Ultimately, the population of eligible voters is estimated, and more precise factors of that do not make the ultimate estimates more accurate. So, numbers were rounded to integers, which might all round down in one row but up in the next. Unfortunately, this seems to lend to a loss of faith in the veracity of the chart, even though the larger message is more important than its excruciating detail.
Uses R for fundamental data aggregation, ggplot for rudimentary plots, and Adobe Illustrator for annotations and final assembly.
Sources: Federal Election Commission (FEC), Historical Election Results: https://www.fec.gov/introduction-campaign-finance/election-results-and-voting-information/
University of Florida Election Lab, United States Voter Turnout: https://election.lab.ufl.edu/voter-turnout/
United States Census Bureau, Voter Demographics: https://www.census.gov/topics/public-sector/voting.html
Methodology: The FEC data for each election year will have a multi-tab spreadsheet of Election results per state, detailing votes per Presidential candidate (when applicable in a General Election year) and candidates for Senator and Representative. A summary (usually the second tab) details nationwide totals.
For example, these are the provided results for 2020:
- Voting Eligible Population: 240,628,443 (VEP, UFEL)
- Ballots counted: 159,729,160 (UFEL, 66.38% turnout)
- Non-voters: 80,899,283 (UFEL, 33.62% inverse of turnout)
- Joe Biden: 81,283,501 (FEC)
- Donald Trump: 74,223,975 (FEC)
- Other: 2,922,155 (FEC, explicitly cast for a candidate)
- Base: 237,706,288 (=VEP-Other)
The determination of "turnout" is a complicated endeavor. Thousands of Americans turn 18 each day or become American citizens who are eligible to vote. Also, thousands more die, become incapacitated, are hospitalized, imprisoned, paroled, or emigrate to other countries. At best, the number of those genuinely eligible on any given election day is an estimation.
Thoughtful approximations of election turnout can be found via the University of Florida Election Lab, which consumes U.S. Census survey data and then refines it according to other statistical information. Some of these estimates can be found here:
https://election.lab.ufl.edu/dataset/1980-2022-general-election-turnout-rates-v1-1/
Per the Election Lab's v.1.2 estimates, the Voting-Eligible Population (VEP) demonstrated a turnout rate of ~66.38%. The VEP does not include non-citizens, felons, or parolees disenfranchised by state laws.
Once we have the total votes and a reliable estimate of turnout, it is possible to calculate non-voters as the ~33.62% who Did Not Vote (the obverse of the turnout estimate). In the instance of the 2020 election, this amounts to about 81M who were eligible on election day but declined to vote.
To calculate the final percentages for this chart, votes for candidates that received less than 3% of the total eligible population were removed. This was done for simplicity. So, for the year 2020, the results were:
- Joe Biden: 34.19%
- Donald Trump: 31.22%
- Non-voters: 34.03%
Note that these numbers do not necessarily add up to 100%. This is the result of rounding errors and the discounting of "Other" votes. As a result, some of the segments of the bars do not align exactly with segments of the same value occurring in adjacent bars. This visual discrepancy may seem concerning, but is expected.
Posted by ptrdo
26 comments
I had never seen a graph like this that shows the people that didn’t vote. That’s maddening.
Ross Perot was truly an outlier: The only remotely feasible 3rd party run (and excellent comedy fodder for the likes of [Dana Carvey](https://www.youtube.com/watch?v=H_RtNzJyAJk))
Still bit of a robbery that Hilary actually didn’t win, but her campaign should have done better in the swing states. Question is if we would have been in the current situation had she actually won, would Trump have won the next one, maybe, would be he have been elected again, probably not.
My fellow Americans has no sense of civil duty, it’s sad to see %s in the 20s picking these ghouls to drive us off a cliff.
Love a great way to visualize the “red wipeout total culture victory” that was 2024 lol
It’s like 2000 was a wake up call to people to vote, then 2016 was another.
Also, half of eligible voters not voting in 80s is wild to think about. We think it’s bad now
[deleted]
What that means is that about 67% of the nation did not vote Trump, nor Harris. (But 100% of the nation has an opinion)
We really should only report results like this because it really illuminates that nobody every truly gets a mandate and they should govern accordingly.
Wild that Biden was the first (and only) modern president to beat the “did not vote” cohort.
Biden is the only one that beat non voters lmao, ppl hated that man for all the wrong reasons
So Biden was the only candidate to get more votes than those didn’t vote? Wow!
For me (and many in Ireland), if you don’t vote, you have no right to an opinion. This was the case about an election some time back; my friends and I ganged up on another: ‘Whist! No vote, no opinion’.
Of the cohort who didn’t vote in 2024, better get their arse to the ballot box in 2026 for the Mid-terms. Look at what not voting does—elects an overweight Oompa Lumpa who is fucking everything.
Disclaimer: the Oompa Lumpa *could* have still won but the chances would have reduced.
Why are the number of decimals in the percentage so inconsistent
We need to organize team yellow.
It would be interesting to see out of the Didn’t vote, how many were actually in swing states that would’ve swung the election. In deep red or blue states I can imagine why many people don’t feel the need/impact to vote
Huh, Harris actually did better than you’d expect based on how much of a blowout the Electoral College was that election. Makes you wonder if a slightly different campaign strategy would’ve given her the win. 😭
I would like to know how much of the did not vote weren’t able to and the reasons. I would say a lot of people had polling places closed, had restrictive vote ID laws, or weren’t interested in either candidate. No matter the reason though it’s embarrassing that the right to vote is so easily dismissed.
However, simply knowing they didn’t vote is not enough because we need to figure out the why to try and get more people voting.
Blows my mind that a lot of people on the IS don’t vote either because of apathy or voter suppression. Very fucked up.
It shows that the Democrats need a bigger turnout to beat the Republicans. When they nominate a flawed candidate, they dont get the turnout, the GOP wins.
the land of the free. free not to vote.
I’m going to look on the positive side and note that voter percentages are going up over time. On the negative side, will there be another fair election that isn’t rigged or suppressed by laws like the one recently proposed that would logistically disenfranchise many citizens without qualifying paperwork (current ID name matching birth name). Hope your wife didn’t change her name for marriage.
It’s not clear to me that engaging people who don’t vote will help democrats. Let’s look at the elections with greater than average turnout:
1992. The increased turnout seems to have gone exclusively to Perot. Bill Clinton got the exact same percentage of the vote at 42% turnout as he did as at 48% turnout.
2004. Higher than normal turnout, Republican trifecta.
2008. Higher than normal turnout because of Obama. Democratic trifecta
2012. Higher than normal turnout because of Obama. Democrats win
2016. Higher than normal turnout. Republican trifecta.
2020. Highest turnout of all time. Possibly due to covid? Democratic trifecta
2024. Next highest turnout of all time. Republican trifecta.
Now, that looks pretty even. If we think that Obama was a uniquely inspiring politician, a once in a generation talent, and exclude his results the result seem to indicate :
**The higher the turnout, the greater percentage chance the candidate favored by low information voters wins.**
The one time (aside from Obama) that higher turnout helped the democrats was during COVID when even the most uneducated and uninformed person could not fail to notice the hundreds of thousands of people dying to COVID under Trump’s watch.
So, I think the hypothesis is borne out both by logic, and by examining historical events, which is why its so odd to see democrats continually pushing to raise voter turnout or even make voting mandatory.
Democrats have won zero unusually high turnout elections when neither Obama nor COVID were ‘on the ballot’.
What do you mean by trifecta? That party won the presidency, house and senate?
Trump was so terrible that he actually galvanized enough people to vote against him to break a 40 year trend
I think libs need to let it go at this point.
Comments are closed.