These graphs are easy to find online. But i wanted to make my own. Python code at https://colab.research.google.com/gist/cavedave/68fe6406876add8d1abc4a4eec6ee9b9/untitled5.ipynb
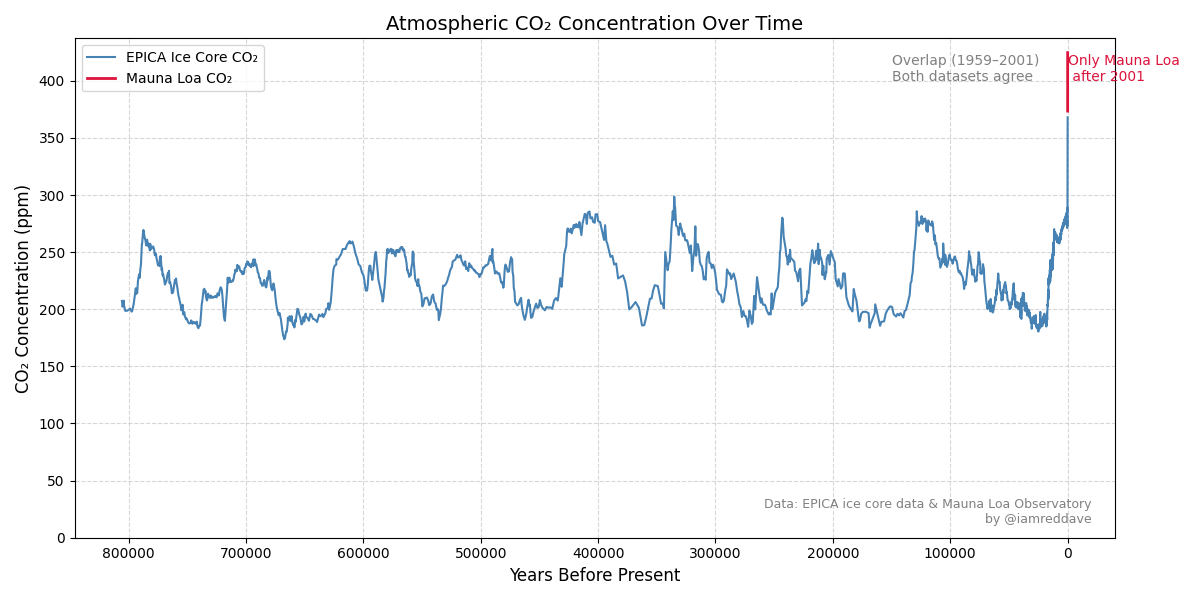
Ice data from https://www.ncei.noaa.gov/access/paleo-search/study/17975
and observatory from https://gml.noaa.gov/ccgg/trends/data.html
Posted by cavedave
1 comment
How is this beautiful? This sub has lost its touch.
Comments are closed.