Note: The Office of Personnel Management stopped making the average age of full-time permanent federal employees available in 2017. We estimated the average age since 2018 using employee age distributions available from OPM. All data reflects September of the stated year.
Note 2: This is pre-DOGE data. Recent changes to federal employment may have impacted the age distribution, and we’ll update the report on our site when fresh data drops.
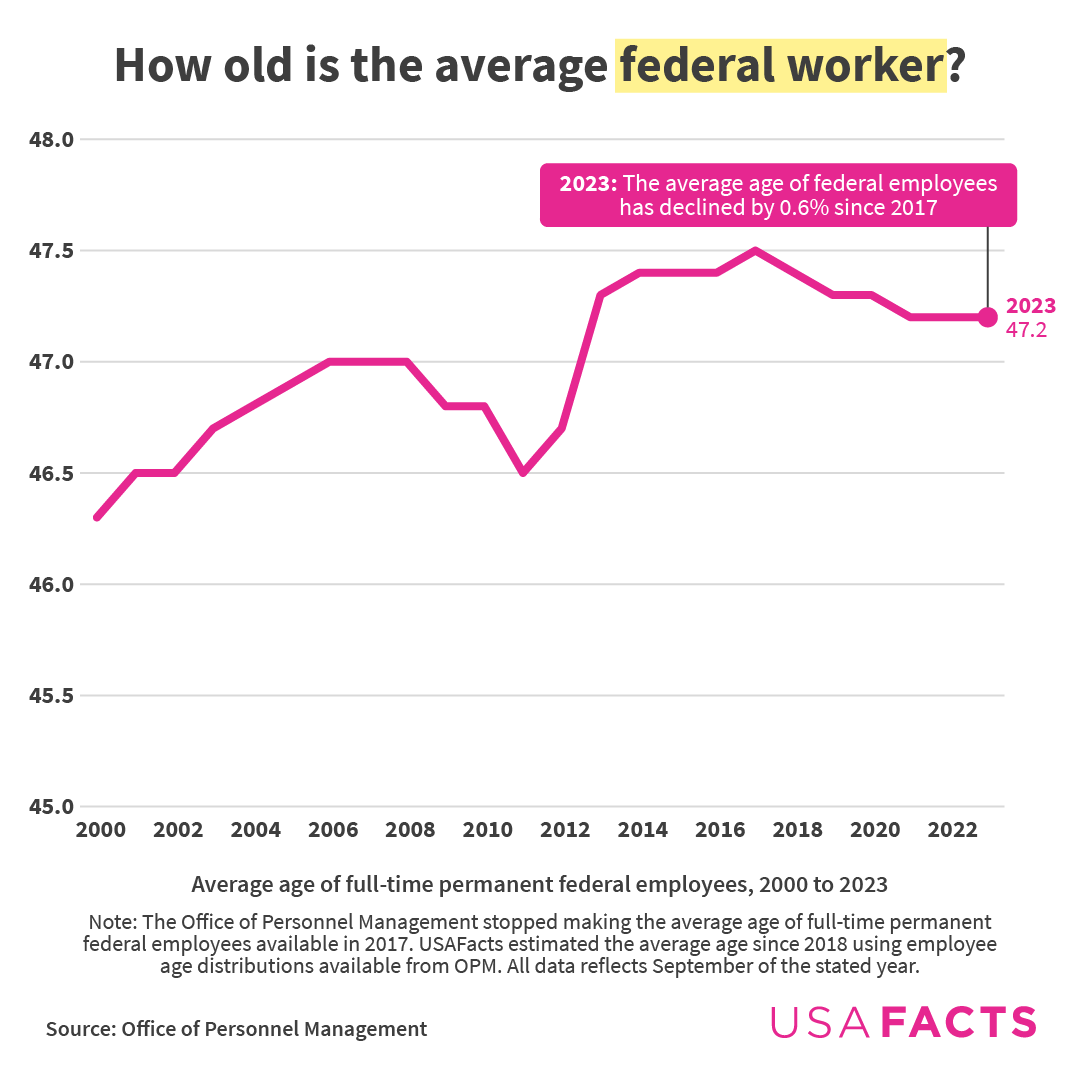
* In 2023, the average federal worker was 47.2, up from 46.3 in 2000.
* The median age of the US labor force as a whole was 42.2 in 2024, according to a Bureau of Labor Statistics (BLS) report.
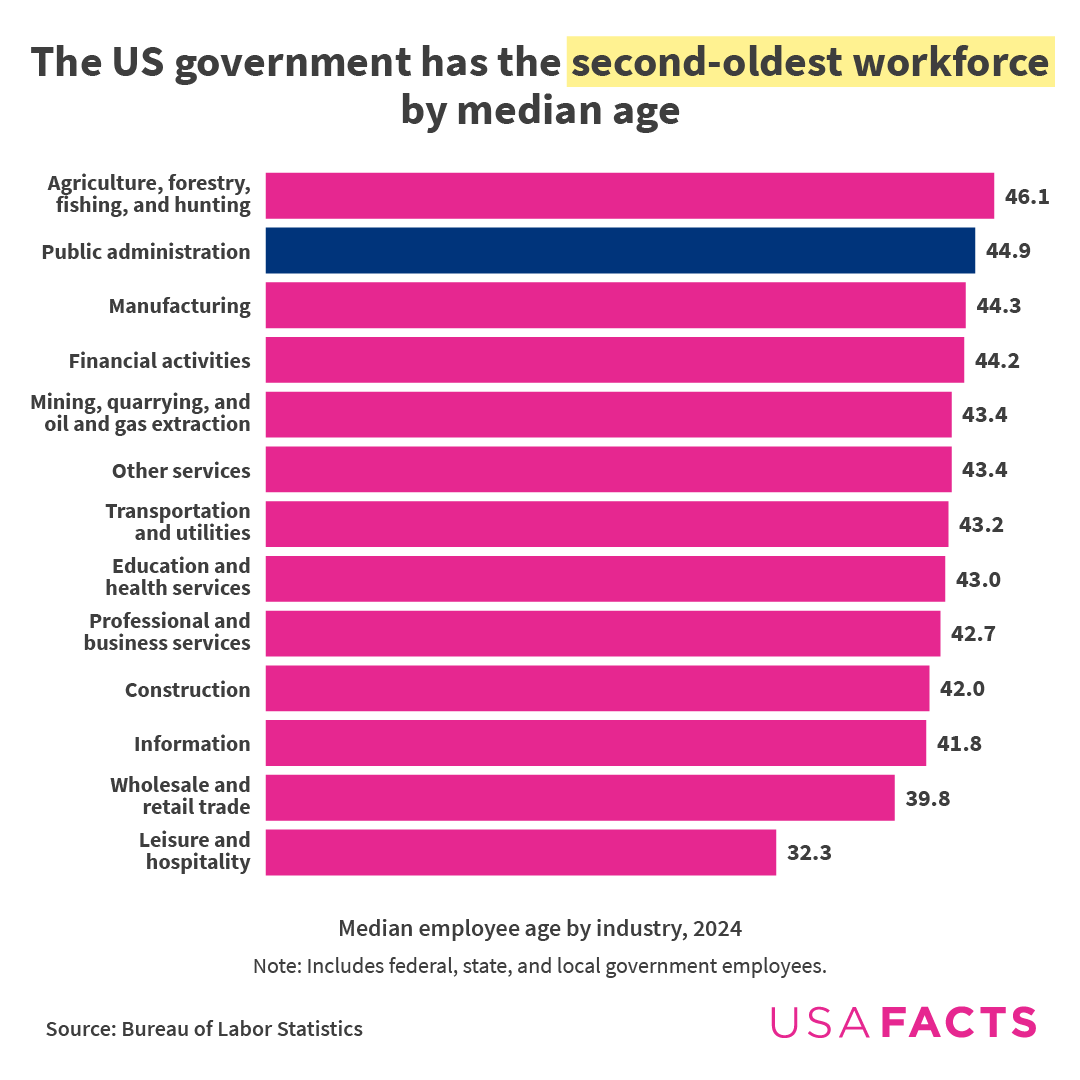
* Compared to other industries, government employees — at the federal, state, and local levels — had the second-highest median age at 44.9.
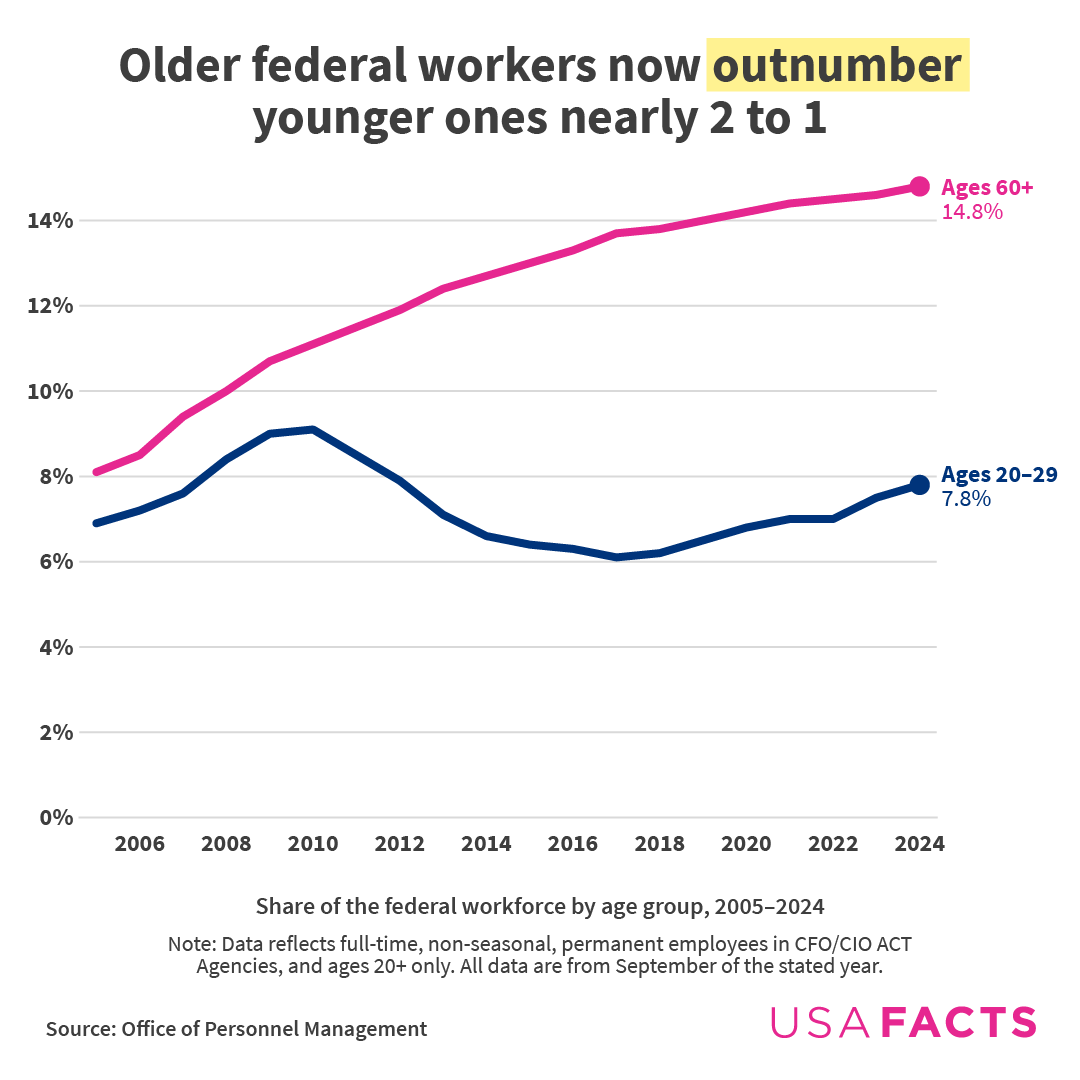
* The gap between older and younger federal workers is getting bigger. In 2005, 8.1% of federal workers were 60+, while 6.9% were in their 20s. By 2024, nearly twice as many workers were in their 60s (14.8%) than their 20s (7.8%).
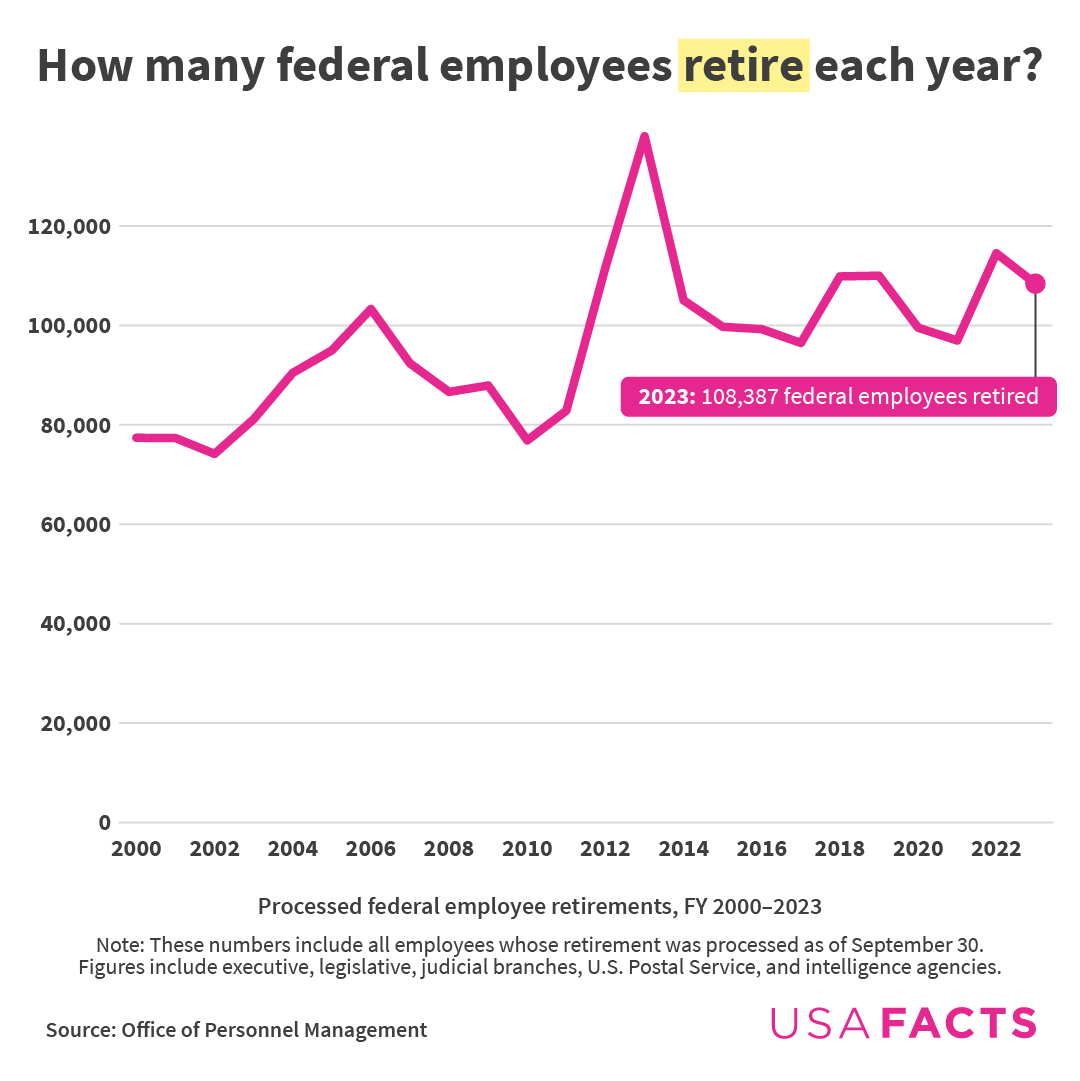
**Retirement:**
* According to OPM, 108,387 federal employees retired between September 2022 and 2023.
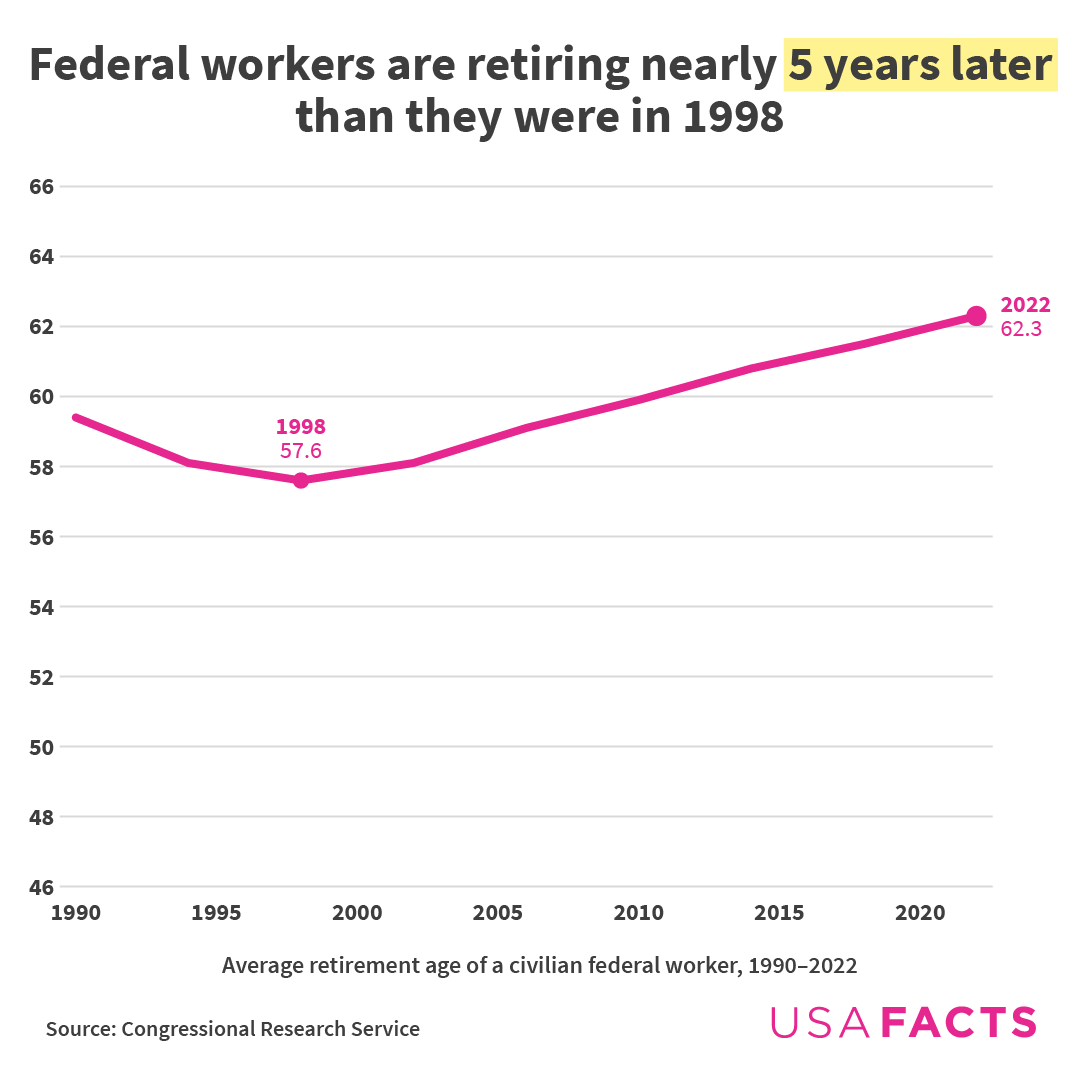
* Federal employees are also retiring *later*: According to Congressional Research Service (CRS) reporting, the average retirement age of federal employees in fiscal year 2022 was 62.3, up 1.5 years from 2014 and 4.7 years from 1998.
* Most federal employees do not have a mandatory retirement age. Some do, though: air traffic controllers must retire at 56, and law enforcement officers, firefighters, and some people who work with nuclear materials must retire at 57 if they’ve been in their role for more than 20 years.
* According to the CRS, 84.9% of federal retirements in 2022 were voluntary. The other 15.1% were involuntary or a consequence of disability or special provisions for law enforcement, firefighters, air traffic controllers, and politicians.
What happened around the great recession with the age dip?
I wonder which countries have the oldest and youngest government workforces
So I can have a career of teaching management basic Microsoft Office skills for another 15 years?
That’s a mixed bag.
the average age dipped between 2017 and 2020 because agencies primarily implemented trump administration staffing cuts by offering early retirement. this graph doesn’t fully capture the biden administration, let alone anything happening in trump pt2.
This seems . . . good, right? In the context of what are primarily office jobs, I’d imagine that workers in their late 40s are incredibly productive. They’ve been around long enough to have a lot of experience, but aren’t phoning it in on the verge of retirement. So that seems to me like the ideal average age.
Someone please tell me if I’m wrong or overlooking something
Can you compare the average retirement age between the sectors (like 4 does for the median age)?
Lots to unpack here:
“Older out numbers Younger”: The younger % was relatively flat (in the 6-9% range), with today’s number similar to 2006. The 60+ year old’s percentage grew at a steady rate over the same time frame. But, comparing this chart to the number of retirees chart, there was a large spike in retirements from 2012-2014, like about 350,000 (you can see the individual datapoints if you go to the website and mouse over each point). Given that, today, there are about 2M people and ~15% of the workforce if 60 or older (so, about 300,000 people), it would seem that the share of 60 and older workers would at least have a wiggle around that timeframe in response to the retirements. But, perhaps the government actually hires a fair number of seasoned people, so one of those 60 year old retirees is replaced by a 55 year old (former state worker or private sector) who wants to get 10 more years in? I dunno.
Bottom line: Without a lot of context about hiring demographics, overall population of the government, comparison to the workforce at large, overall societal trends, etc. it’s hard to draw any conclusions from this dataset.
Might have to redo these graphs with all of the recent layoffs 🙃
This seems fine, it means that these jobs have a lot of loyal workers who do their jobs well and therefore stay there for a long time. This makes them very experienced and proficient. It’s not really a problem.
The last chart is the big one. Average age of retirement increasing 4.7 years over 24 years is pretty dramatic, especially when it had been declining for 8 straight years. (And especially considering how many early retirement incentives were offered during the first trump administration.)
You k ow what would make this even worse? Why don’t we fire everyone hired in the last year for fun?
![Six charts on the age of the federal government workforce [OC]](https://www.europesays.com/wp-content/uploads/2025/04/yik92jkf6twe1-1080x1024.png)
13 comments
Sources: [Office of Personnel Management](https://www.opm.gov/policy-data-oversight/data-analysis-documentation/federal-employment-reports/reports-publications/full-time-permanent-age-distributions/#content), [Bureau of Labor Statistics](https://www.bls.gov/cps/cpsaat18b.htm), [Congressional Research Service](https://www.congress.gov/crs-product/98-972)
Tools: Datawrapper, Illustrator
Note: The Office of Personnel Management stopped making the average age of full-time permanent federal employees available in 2017. We estimated the average age since 2018 using employee age distributions available from OPM. All data reflects September of the stated year.
Note 2: This is pre-DOGE data. Recent changes to federal employment may have impacted the age distribution, and we’ll update the report on our site when fresh data drops.
Here’s some context for these charts, all taken from [here](https://usafacts.org/articles/how-old-is-the-federal-workforce/).
**How old is the federal workforce?**
* In 2023, the average federal worker was 47.2, up from 46.3 in 2000.
* The median age of the US labor force as a whole was 42.2 in 2024, according to a Bureau of Labor Statistics (BLS) report.
* Compared to other industries, government employees — at the federal, state, and local levels — had the second-highest median age at 44.9.
* The gap between older and younger federal workers is getting bigger. In 2005, 8.1% of federal workers were 60+, while 6.9% were in their 20s. By 2024, nearly twice as many workers were in their 60s (14.8%) than their 20s (7.8%).
**Retirement:**
* According to OPM, 108,387 federal employees retired between September 2022 and 2023.
* Federal employees are also retiring *later*: According to Congressional Research Service (CRS) reporting, the average retirement age of federal employees in fiscal year 2022 was 62.3, up 1.5 years from 2014 and 4.7 years from 1998.
* Most federal employees do not have a mandatory retirement age. Some do, though: air traffic controllers must retire at 56, and law enforcement officers, firefighters, and some people who work with nuclear materials must retire at 57 if they’ve been in their role for more than 20 years.
* According to the CRS, 84.9% of federal retirements in 2022 were voluntary. The other 15.1% were involuntary or a consequence of disability or special provisions for law enforcement, firefighters, air traffic controllers, and politicians.
What happened around the great recession with the age dip?
I wonder which countries have the oldest and youngest government workforces
So I can have a career of teaching management basic Microsoft Office skills for another 15 years?
That’s a mixed bag.
the average age dipped between 2017 and 2020 because agencies primarily implemented trump administration staffing cuts by offering early retirement. this graph doesn’t fully capture the biden administration, let alone anything happening in trump pt2.
This seems . . . good, right? In the context of what are primarily office jobs, I’d imagine that workers in their late 40s are incredibly productive. They’ve been around long enough to have a lot of experience, but aren’t phoning it in on the verge of retirement. So that seems to me like the ideal average age.
Someone please tell me if I’m wrong or overlooking something
Can you compare the average retirement age between the sectors (like 4 does for the median age)?
Lots to unpack here:
“Older out numbers Younger”: The younger % was relatively flat (in the 6-9% range), with today’s number similar to 2006. The 60+ year old’s percentage grew at a steady rate over the same time frame. But, comparing this chart to the number of retirees chart, there was a large spike in retirements from 2012-2014, like about 350,000 (you can see the individual datapoints if you go to the website and mouse over each point). Given that, today, there are about 2M people and ~15% of the workforce if 60 or older (so, about 300,000 people), it would seem that the share of 60 and older workers would at least have a wiggle around that timeframe in response to the retirements. But, perhaps the government actually hires a fair number of seasoned people, so one of those 60 year old retirees is replaced by a 55 year old (former state worker or private sector) who wants to get 10 more years in? I dunno.
Bottom line: Without a lot of context about hiring demographics, overall population of the government, comparison to the workforce at large, overall societal trends, etc. it’s hard to draw any conclusions from this dataset.
Might have to redo these graphs with all of the recent layoffs 🙃
This seems fine, it means that these jobs have a lot of loyal workers who do their jobs well and therefore stay there for a long time. This makes them very experienced and proficient. It’s not really a problem.
The last chart is the big one. Average age of retirement increasing 4.7 years over 24 years is pretty dramatic, especially when it had been declining for 8 straight years. (And especially considering how many early retirement incentives were offered during the first trump administration.)
You k ow what would make this even worse? Why don’t we fire everyone hired in the last year for fun?
Comments are closed.