![What actually makes people use Starbucks’ mobile app in stores? [OC]](https://www.europesays.com/wp-content/uploads/2025/04/2kgeh9lltzwe1-1127x1024.png)
Just used a ai tool to make a cool breakdown from an experiment on what drives customers to actually use the Starbucks mobile app for in-store orders — and the results make a lot of sense.
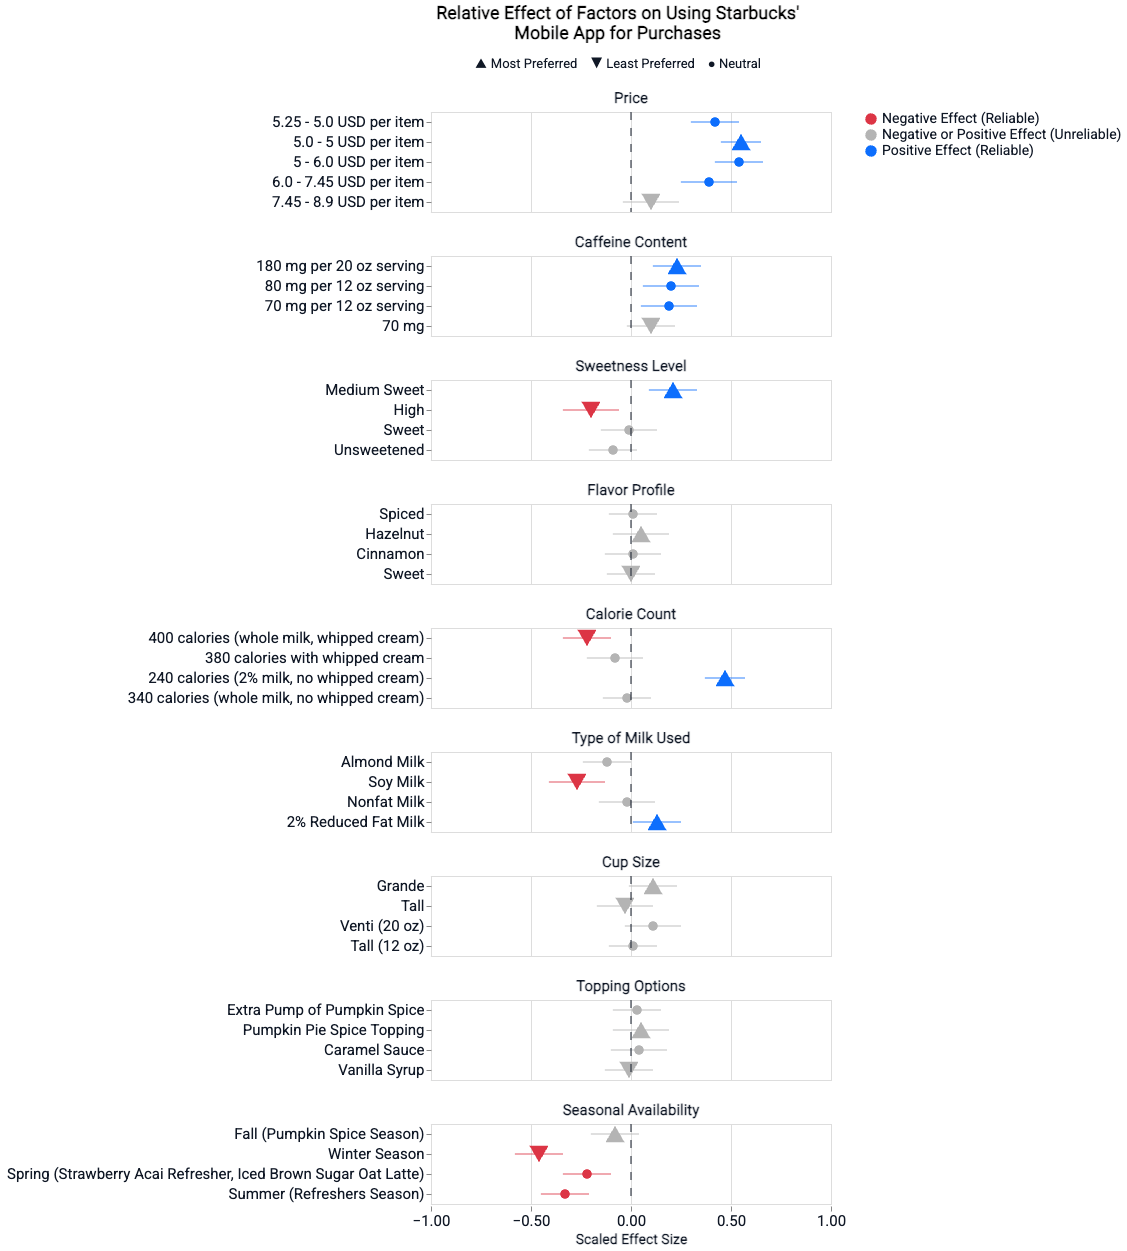
Turns out, people are more likely to use the app when it offers:
- Drinks around 240 calories (health-conscious choices)
- Priced between $5-$6 (affordable, but not too cheap)
- Around 180mg of caffeine per 20 oz (solid energy boost)
- Medium sweetness (not too sugary, not too bland)
- 2% reduced fat milk as a go-to option
- Seasonal drinks (people love limited-time stuff)
- And most importantly — customization: milk type, sweetness level, even toppings like Pumpkin Pie Spice
So yeah, it’s less about just grabbing coffee and more about personalization, a sense of value, and little seasonal touches that make it feel special.
Curious — if you’re a regular Starbucks app user, what matters most to you when ordering? Source Link
Posted by Nervous-Midnight-175
5 comments
If I’m in a Starbucks, I use the app to order because then I can see all of my different options without having to ask the barista what they have.
I feel like you can’t say it’s less about grabbing coffee when that isn’t one of your data points.
I use the app for an in-store order when I need coffee quickly on my way to something else. Everything else is secondary.
With the app, I can make all possible requests and changes and order it before I get there so it’s waiting at the counter for me or I can grab it in the drive thru, and you earn rewards to put towards future purchases. It’s a convenience thing.
Sidenote, this is why most people use any fast food app. The above reasons plus special, app-only deals.
I have the feeling that correlation and causation are might be getting mixed here.
As understand the plot, it show the preferences of app users (please correct me if I’m wrong here). So … it basically says: people who use the app prefer to order their coffee as described in the graph.
(Note: it might be helpful to have a second data set with non-app users for comparison, but again – I don’t know what data was used and can only guess)
This doesn’t mean that the coffee preference is a reason to use the app. (It could be, but the data -as I understand it- doesn’t include this information)
I’m not sure you’re interpreting this data correctly.
Why do all of your price categories have positive effects (at least nominally)? Did you exclude price categories in your forest plot? Same question for caffeine contents?
Doesn’t this say people are **LESS** likely to use the app for seasonal drinks, yet you conclude the opposite?
High sugar and whole milk are also “customization” but are both less likely to be ordered through the app. Why do you conclude that “customization” is a factor driving app usage?
You say 2% milk is the go-to option, but is it also the **default** option in the app? Same question for medium sweetness?
This analysis would and should get a failing grade in an introductory statistics class.
Comments are closed.