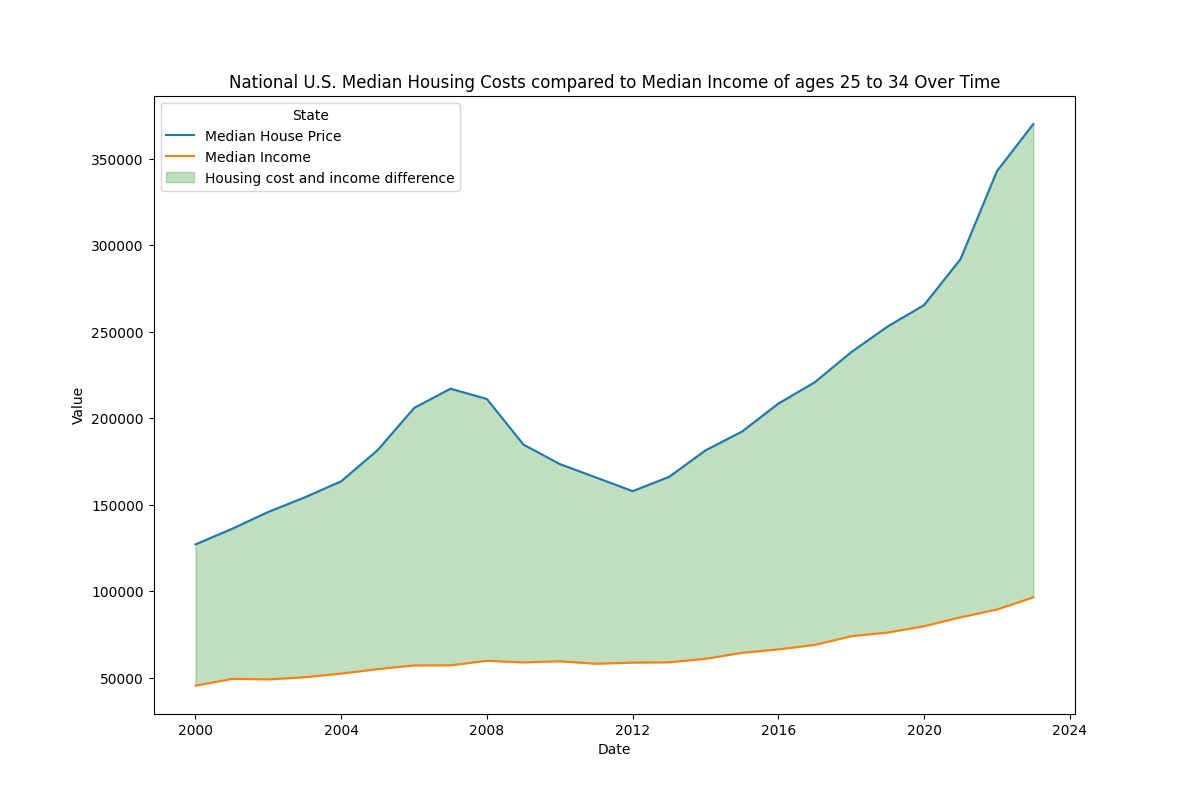
Data from:
https://www.zillow.com/research/data/
https://fred.stlouisfed.org/data/CXUINCBEFTXLB0403M
It would be better if I used some older dates, but I couldn't find anything.
Posted by Wormy-Chan
Data from:
https://www.zillow.com/research/data/
https://fred.stlouisfed.org/data/CXUINCBEFTXLB0403M
It would be better if I used some older dates, but I couldn't find anything.
Posted by Wormy-Chan
22 comments
y axis should start from 0
median income for an individual 24-34 is 96k?
that’s more than double US median. gotta be missing something here?
This would be better represented as a ratio of the blue line to the orange line, to represent the “years to pay back” vs some arbitrary dollar amount, for example if the salary and home price both doubled, the green area would also double but this is explained by normal inflation and nothing is different except the buying power of a dollar is half, which nobody really cares about as long as they can still afford a house.
This, but with Canada on the graph in adjusted as USD
This is a terrible way to represent the median income-to-house-price ratio. Using absolute values would naturally widen the gap due to inflation alone, whereas the goal should be to show that housing is becoming more expensive in **real terms**.
Now plot it adjusted for average home square footage, and for build cost per square foot during each year
You’ll find that because square footage went up, and the quality and cost of creating that square footage went up, this effect almost totally disappears
People like to think housing has gotten far more expensive for the same product. But really it’s gotten far more expensive because homes are much bigger and much more involved now than 4 poorly insulated walls and a foundation. If you tried to offer people the typical home of the 1930s at the equivalent inflation adjusted rate, nobody would agree to live in it.
Well… if it’s anything like the stock market this means housing market going to crash hard because I just bought my house at the peak!
Ah… Back in the good old days of the F-ing HOUSING BUBBLE of 2007.
Are either/both of those variables adjusted for inflation?
You should be looking at the mortgage cost + taxes instead of the purchase price. The median person is not buying a house outright. The home affordability index already does this for you. [https://www.atlantafed.org/research/data-and-tools/home-ownership-affordability-monitor](https://www.atlantafed.org/research/data-and-tools/home-ownership-affordability-monitor)
I’d like to see at least 50 years data… so then we can say to boomers, “SEE!?”
Hey it’s like the QE started in 2012 didn’t actually help
The real economy
Just pull those bootstraps tighter, sonny
Y’all got any more of them housing crashes laying around? Could use one right around now.
Can’t afford a house? Thank a billionaire.
Maybe a recession will free up some resources for housing development. But I do consider that unlikely.
So I should have bought 20 years ago?
Wages always lag assets.
Inflation usually hits in this order
1. Assets
2. Goods and services
3. Wages
With usually a 3 to 5 year lag. Not such an issue when inflation is 2% but anything over ~4% compounds pretty quickly.
Man those 2009-2012 times were so good.
Here is the thing. Housing prices seem to go up when the job market is good and down when it crashes. So either you have money and it’s not enough to buy a house or houses are cheap and you have no job or the employment market is terrible.
Also making this worse are interest rates. This is a huge part of housing affordability. This actually makes the problem worse now, however at certain points it was mostly high interest rates making housing less affordable and knocking down the prices.
The truth is that a very similar percentage of people own their homes now than in the past and the market tends to reflect supply and demand. Right now high interest rates are making it so people are not wanting to sell and also homes are not being built at a nearly fast enough rate. This is creating supply constraints that are not meeting demand thus making houses more expensive despite the interest rates being higher than in the past. So it’s a particularly bad time to buy a house.
The last time homes were thus unaffordable was in the early 80s there was no real crash that occurred to make things affordable and it took about 10 years for there to be an equilibrium between interest rates and housing costs that equated to “affordable.”
Just as well you shaded the difference!
https://preview.redd.it/kp2i6pmytnxe1.png?width=1079&format=png&auto=webp&s=fdf50209fd931acefa6edb875d5046b1425d52f0
You didn’t factor in the cost of financing and interest rates. it completely changes the picture. [here’s my analysis ](https://www.linkedin.com/posts/davidpyoung_a-contrarian-perspective-on-housing-affordability-activity-7178169708905439232-n_6Y?utm_source=share&utm_medium=member_android&rcm=ACoAAAE32VEBkcLpQNiuQmBn2yVo4DszScafOkg)
This is a major reason why the Democrats lost all 3 branches of government. The media and democrats and even people all over Reddit were constantly lying about how unaffordable many essential goods like housing, gas, groceries, etc had gotten. They kept pointing at inflation numbers that literally have not taken those things into account since the 1980’s.
Comments are closed.