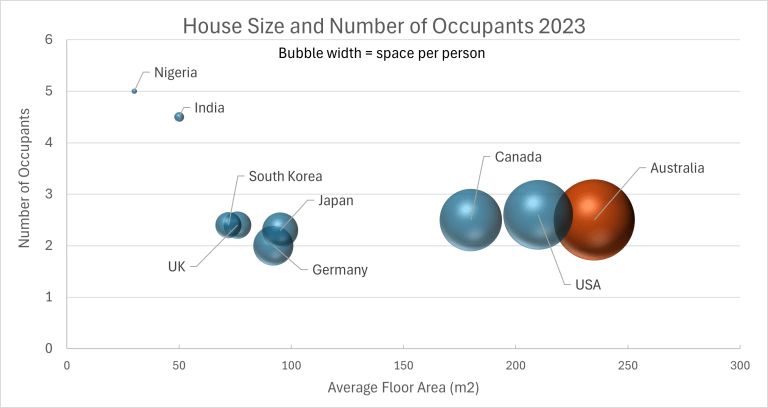
Made in Excel with Data from the following sources:
Australia
• Home size: 235 m² – ABS, https://www.abs.gov.au/articles/average-floor-area-new-residential-dwellings
• Household size: 2.5 – ABS Census, https://www.abs.gov.au/census/find-census-data/quickstats/2021/AUS
United States
• Home size: ~210 m² – U.S. Census, https://www.census.gov/construction/chars/highlights.html
• Household size: 2.6 – U.S. Census QuickFacts, https://www.census.gov/quickfacts/fact/table/US
Canada
• Home size: ~180 m² – StatCan, https://www150.statcan.gc.ca/n1/pub/75-006-x/2020001/article/00008-eng.htm
• Household size: 2.5 – StatCan, https://www150.statcan.gc.ca/n1/daily-quotidien/220727/dq220727b-eng.htm
United Kingdom
• Home size: 76 m² – BBC/UK Housing, https://www.bbc.com/news/uk-14921661
• Household size: 2.4 – ONS, https://www.ons.gov.uk
Germany
• Home size: 92 m² – Eurostat, https://ec.europa.eu/eurostat
• Household size: 2.0 – Destatis, https://www.destatis.de/EN
France
• Home size: ~91 m² – Deloitte Property Index, https://www2.deloitte.com/ce/en/pages/real-estate/articles/property-index.html
• Household size: 2.2 – INSEE, https://www.insee.fr/en/statistiques
Japan
• Home size: 95 m² – Real Estate Japan, https://resources.realestate.co.jp
• Household size: 2.3 – OECD, https://data.oecd.org/people/household-size.htm
South Korea
• Home size: ~72 m² – KOSIS, https://kosis.kr/eng/
• Household size: 2.4 – OECD, https://data.oecd.org/people/household-size.htm
India
• Home size: ~50 m² – Economic Times, https://economictimes.indiatimes.com
• Household size: 4.5 – World Bank, https://data.worldbank.org/indicator/SP.HOU.FAML.ZS?locations=IN
Nigeria
• Home size: ~30 m² – UN Habitat (est.)
• Household size: 5.0 – ArcGIS, https://www.arcgis.com/home/item.html?id=fbb3c5c5fa9f4429be56af8b11ef4643
Posted by LivingMoreWithLess
26 comments
Maybe if you are counting the places in the back of Burke and northern territories where there is a 1000sqm house and you average them with the Sydney apartments…… otherwise it doesn’t make sense
Do these numbers include basements? A cursory google search indicates that they typically don’t count towards the floor area. I would caution just comparing these numbers because different countries might count floor area differently. A cursory google search indicates that basements are often not counted towards floor area.
Australian houses very rarely have basements. It’s just not necessary here because it never freezes in most of the populated part of the country, so you can place stuff like hot water systems just outside.
Compared to Canada and the US where basements are more common, Australian homes might just have a bit more floor area to make up for the lack of a basement.
What not bubble area is measured area? This graphic shows blob areas proportional to the square of measured area, so radically exaggerates the differences.
Edit: clearer wording.
Thats because they have a huge amount of land for a relatively reduced population when compared to other regions. I remember that a friend of mine went to Australia to work in a farm taking care of different animals and the size of the land was similar to the entire small town where he lived…it was just crazy 😂😂
Whether it is an apartment (multi-family housing) or a detached house will be a major factor. If you compare detached houses, the difference will be somewhat smaller.
Bubble width is space per person? With no legend it’s really impossible to tell what it is, but this is the most important stat! I don’t want to see house size, just space per person!
Your BBC link is dead too.
When you have nothing but open space, people tend to start using a lot of it.
cubes may be a better visual, but I do like that you tried to show some dimension with spheres
Would love to see this stat in actual CBD’s cause it’ll be way different for Australia. You are including rural properties which are enormous.
Damn I had to come to the comments and read several before I realized this was not about horses
Really changes perspective there
It’s worth noting that dwelling area includes garages and balconies/decks in Australia which may skew the data.
Space per person should be bubble area, not bubble width. Using bubble width exaggerates the differences. For example, this data is saying Australians have about 20 times as much space as Nigerians but the Australian bubble is about 400 times bigger in area as shown.
Someone has to make huge profits selling unnecessarily excessive amounts of building materials on each job. The spiv in the housing sector is truly alive and well in the land down under.
What is this garbage?
I gave up trying to look at the data because most of your sources are useless or incorrect links.
I was trying to see if you were doing something basic, like an apples to apples comparison, but after seeing Australian data is average new build and US data is median build, then being unable to see anything else (so we can’t see if anyone else is using average or median, or if they’re new builds or existing, etc.), I am prepared to just write this off as useless garbage.
Edit: Ah, turns out you’re just trying to advertise you youtube channel and books
Damn… made me curious and… here in Japan houses are on average bigger and less populated than in France and Spain… huh
Its just that city apartments get smaller… while houses out there get bigger hmmmm
Ofc needs to have a panic room to hide when a giant spider crawls off the toilet.
You can’t double the radius of a circle to indicate twice as large area of housing, because that way you’re showing a 4 times as large bubble, which is just plain WRONG.
The homes in USA, Australia, and Canada are all no more than a few centuries old.
I’m talking CBD. This is new growth zones out in bum fuck. Make the data comparable and correct. It’s so variable in Australia otherwise as we could include homesteads or ranches as “homes”
This doesn’t make any sense to me. I’ve seen many examples of both, and in my mind the average Aus house about 1,000 sq ft smaller.
But they’re full of spiders
Do any Aussies care to share what materials your builders primarily use for home construction?
Sure that the data you’ve used is about size of houses and not housing in general? Share of population living in apartments varies widely between countries.
I’d love to see the averages of houses built in the last 15 ish years. Canada has an enormous problem with developers building tiny condos as investment vehicles, that it would be absolutely impossible to raise a child in.
You’re showing area (x) average occupants (y) and then the ratio as area of the bubble? You’re already demonstrating that the average area per occupant goes up since the occupancy levels out while area goes up. A third metric like average cost converted to USD or supply would be more appropriate as a third dimension.
Averages don’t make sense for data that is not normally distributed.
Comments are closed.