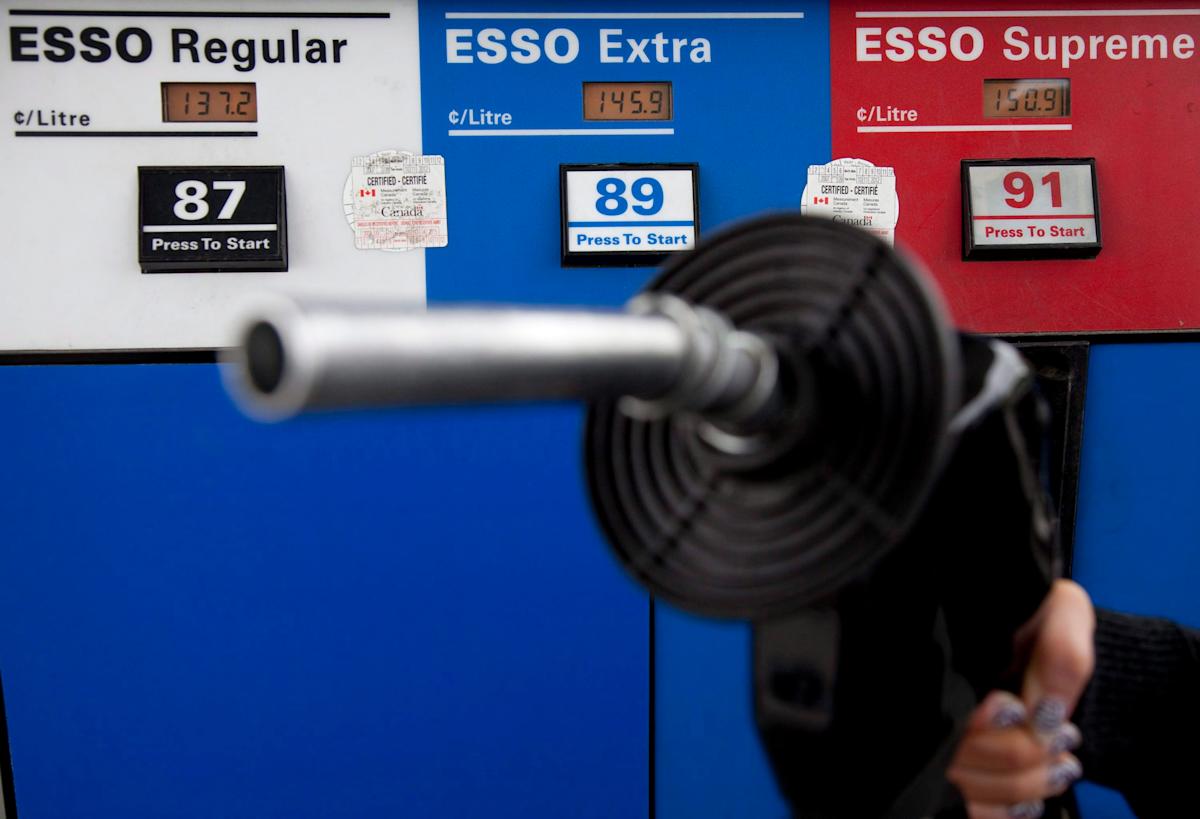

Gas prices are displayed as a motorist prepares to pump gas at a station in North Vancouver on May 10, 2011. (THE CANADIAN PRESS/Jonathan Hayward) · The Canadian Press
Canada’s gas price average is down over 19 per cent year-over-year, according to data from Kalibrate spanning more than 80 cities nationwide. The decline over the past 12 months at the pumps comes as oil prices booked their biggest monthly drop since 2021 in April.
U.S. benchmark West Texas Intermediate (CL=F) prices fell about 16 per cent last month, while European Brent crude (BZ=F) dropped closer to 17 per cent.
While crude oil prices are directly linked to gasoline prices, refining costs, taxes, distribution, and fluctuations in currency exchange rates are also major factors.
Canada’s national gas price average dipped 0.3 per cent to $1.426 per litre of regular fuel between April 24 and May 1. Over the past week, the biggest price jumps were in Abbotsford, B.C., Gatineau, Que., and Brandon, Man.
On May 1, 2024, the national average price for a litre of regular fuel was $1.765.
Follow Yahoo Finance Canada for more weekly gas price updates. Scroll below to find your nearest city.
(All figures in CAD cents)
Location
Apr. 24
May. 1
Price Change
Canada Average (V)
142.9
142.6
-0.3
WHITEHORSE
161.9
161.9
0
VANCOUVER*
160
164.8
4.8
VICTORIA
159.6
159
-0.6
PRINCE GEORGE
139.2
137.8
-1.4
KAMLOOPS
145.6
145.3
-0.3
KELOWNA
144.3
144.1
-0.2
FORT ST. JOHN
140.9
135.4
-5.5
ABBOTSFORD
142.2
152.9
10.7
YELLOWKNIFE
144.7
144.9
0.2
CALGARY*
132.9
127.2
-5.7
RED DEER
120
126.2
6.2
EDMONTON
128.2
123.5
-4.7
LETHBRIDGE
125.1
124.7
-0.4
LLOYDMINSTER
125.2
123.5
-1.7
GRANDE PRAIRIE
129.7
129.4
-0.3
REGINA*
135.6
135.6
0
SASKATOON
135.1
135.4
0.3
PRINCE ALBERT
133.3
132.6
-0.7
MOOSE JAW
135.8
135.7
-0.1
WINNIPEG *
134.2
131.9
-2.3
BRANDON
116.7
123.6
6.9
CITY OF TORONTO*
135.8
135.7
-0.1
BRAMPTON
136.2
136.2
0
ETOBICOKE
136
136.1
0.1
MISSISSAUGA
135.8
135.1
-0.7
NORTH YORK
136.3
136.3
0
SCARBOROUGH
135.9
135.9
0
VAUGHAN/MARKHAM
136
135.8
-0.2
OTTAWA
134.4
134.6
0.2
KINGSTON
127.6
126.9
-0.7
PETERBOROUGH
129.5
126.6
-2.9
WINDSOR
132.5
134
1.5
LONDON
136.4
136.1
-0.3
SUDBURY
132.9
132.2
-0.7
SAULT STE MARIE
128.5
128.3
-0.2
THUNDER BAY
137.3
133.7
-3.6
NORTH BAY
123.6
124.9
1.3
TIMMINS
134.7
134.7
0
HAMILTON
131.9
133.5
1.6
ST. CATHARINES
130.3
130.7
0.4
BARRIE
135.3
135.4
0.1
BRANTFORD
132.2
129.4
-2.8
GUELPH
134.7
135.6
0.9
KITCHENER
133.3
135.4
2.1
OSHAWA
135.8
135.1
-0.7
SARNIA
128.2
129.1
0.9
MONTRÉAL*
159.9
158.8
-1.1
QUÉBEC
153.7
153.5
-0.2
SHERBROOKE
152.6
150.5
-2.1
GASPÉ
157.4
157.4
0
CHICOUTIMI
138.2
141.6
3.4
RIMOUSKI
153.4
151.4
-2
TROIS RIVIÈRES
150.4
147.7
-2.7
DRUMMONDVILLE
154.3
154.3
0
VAL D’OR
159.6
159.7
0.1
GATINEAU
134.5
143.8
9.3
SAINT JOHN*
134.8
137.6
2.8
FREDERICTON
135.2
138.2
3
MONCTON
135.4
138
2.6
BATHURST
134
138.4
4.4
EDMUNDSTON
134.6
137.3
2.7
MIRAMICHI
136.7
139.6
2.9
CAMPBELLTON
136.8
139.6
2.8
SUSSEX
135.2
136.6
1.4
WOODSTOCK
136.7
139.5
2.8
HALIFAX*
135.2
140
4.8
SYDNEY
137.1
141.9
4.8
YARMOUTH
136.2
141
4.8
TRURO
136.3
141.1
4.8
KENTVILLE
135.8
140.6
4.8
NEW GLASGOW
136.3
141.1
4.8
CHARLOTTETOWN*
142.7
147.3
4.6
ST JOHNS*
144.5
147.2
2.7
GANDER
148.3
148.7
0.4
LABRADOR CITY
151.7
154.3
2.6
CORNER BROOK
145.5
148.2
2.7
GRAND FALLS
148.3
149.1
0.8
SOURCE: KALIBRATE • All figures in CAD cents
Story continues