Quick overview
WTI crude oil is finding support at $61.60, which is right on the 50-day EMA at $60.72. This is the key battleground for bulls and a potential launchpad for a new rally. Despite the recent volatility, the overall market is still cautiously optimistic with the easing of trade tensions and diplomatic developments.
Support and Setup
WTI is in an ascending channel and has recovered a lot from the April low of $57.73. $61.60 is the key level as it’s not only the 50-day EMA but also a horizontal level that was resistance previously. This makes it more likely to bounce if it holds.
But if it breaks below this zone, it could go to $60.21 and then $58.98. Watch the MACD too, although it’s losing momentum, it’s still positive and the trend could still be bullish.
Upside Targets
If $61.60 holds, WTI could go to $63.59, the upper channel boundary. Then $64.83 if the broader market improves with trade optimism and diplomatic progress.
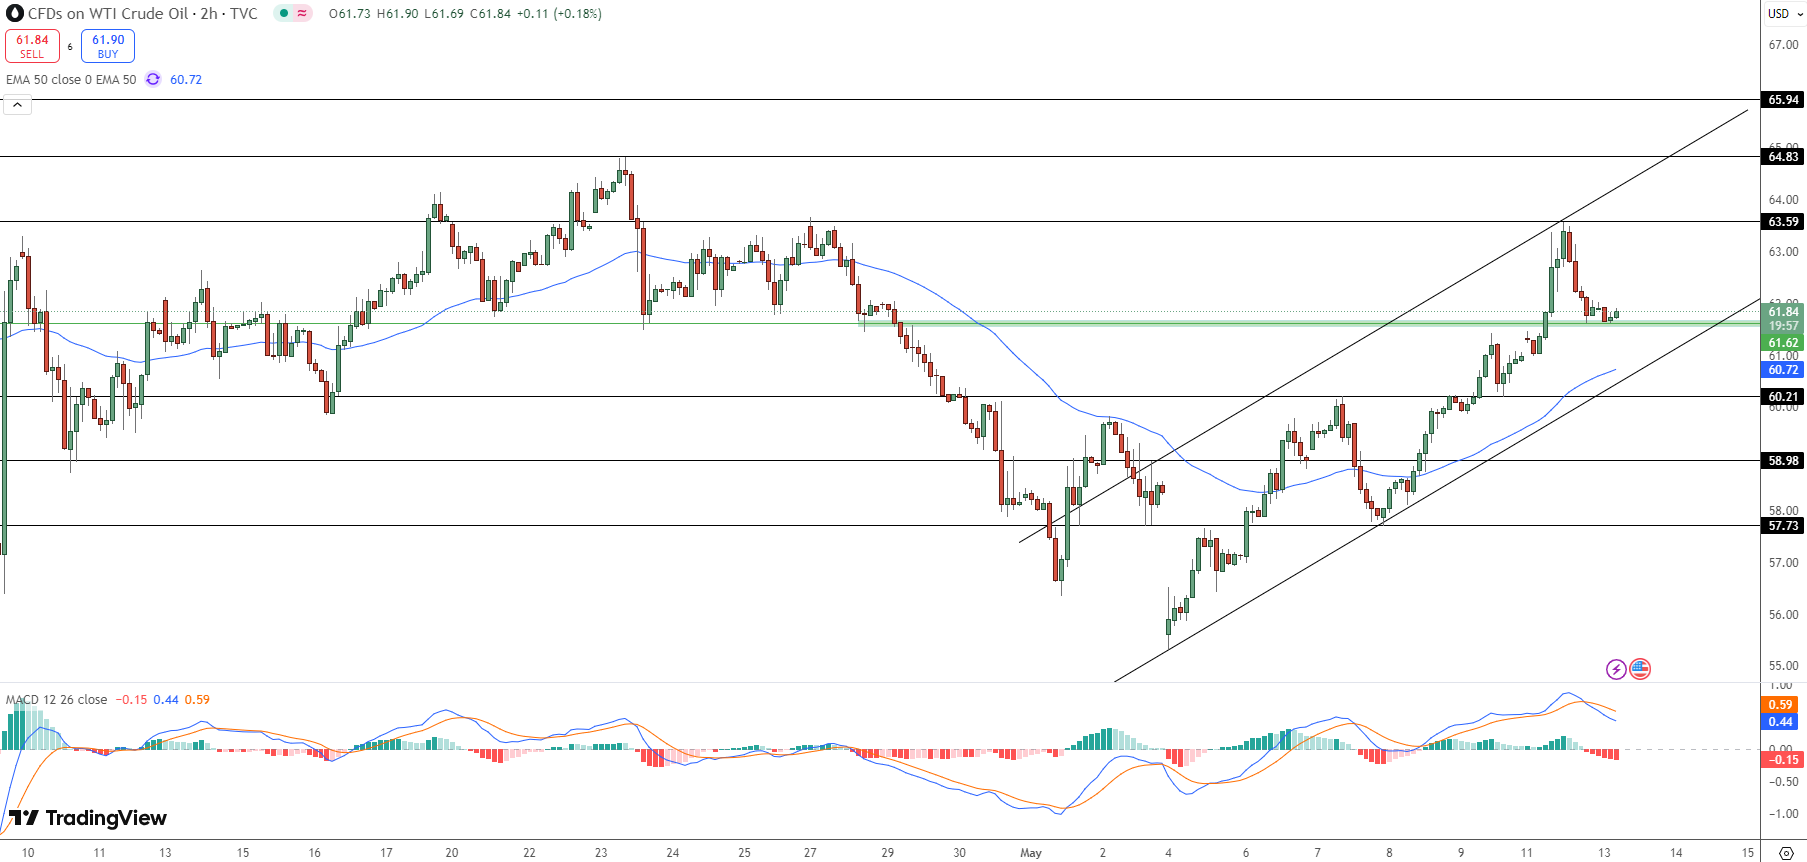 WTI Crude Oil Price Chart – Source: TradingviewTraders to Note
Support Zone: $61.60 (50-day EMA and horizontal level)
Immediate Resistance: $63.59 (Channel upper boundary)
Broader Resistance: $64.83 (Previous high)
Downside Risk: Break below $61.60 could trigger a sell to $60.21 or lower
Momentum Signal: MACD is positive but weakening, could be consolidation or pullback
Arslan Butt
Index & Commodity Analyst
Arslan Butt serves as the Lead Commodities and Indices Analyst, bringing a wealth of expertise to the field. With an MBA in Behavioral Finance and active progress towards a Ph.D., Arslan possesses a deep understanding of market dynamics.His professional journey includes a significant role as a senior analyst at a leading brokerage firm, complementing his extensive experience as a market analyst and day trader. Adept in educating others, Arslan has a commendable track record as an instructor and public speaker.His incisive analyses, particularly within the realms of cryptocurrency and forex markets, are showcased across esteemed financial publications such as ForexCrunch, InsideBitcoins, and EconomyWatch, solidifying his reputation in the financial community.
Related Articles