The flowchart of our system is presented in Fig.┬Ā1. First, dentists upload the examineeŌĆÖs panoramic radiography. And, personal information will be also associated with the system. Then, the system will segment teeth and detect dental diseases autonomously in panoramic radiographs. In addition, we provide a rich set of user interfaces enabling the dentists to revise the tooth segmentations and the lesion location for analysis of oral diseases. Our system allows for detecting six common oral diseases, including caries, pulp exposure, periradicular lesions, impacted teeth, residual roots and missing teeth. After that, a rule-based Natural Language Processing (NLP) method is provided to generate electronic medical records, including visual charts of oral health status and radiology reports. Finally, we conduct a statistical survey and visual analysis of disease characteristics and group characteristics within the examined group. We employ multi-dimensional images, such as heat maps and bar charts, to illustrate disease types, distribution, and associations. To assess the systemŌĆÖs effectiveness and usability, we conduct expert interviews and a quantitative questionnaire survey. The innovative system greatly aids in the detection, prevention, and treatment of oral diseases, offering improved oral health management for the public.
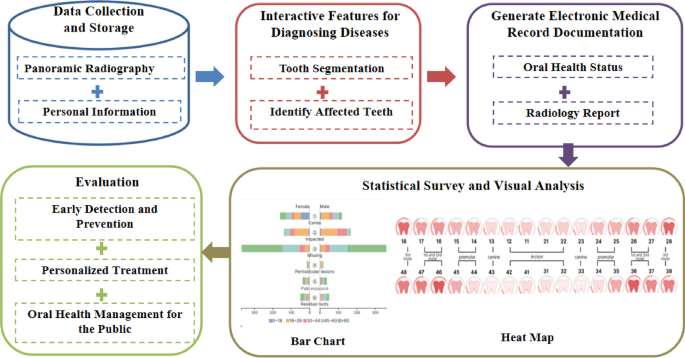
The flowchart of our system.
Data collection
The panoramic radiographs were retrospectively selected from an image database of patients who visited the hospital between November 2023 and January 2024. Then, the dataset was constructed by extracting age, gender, and panoramic radiographs. The patients gave their informed consent before any panoramic radiographs were taken, and their privacy was protected when using the data for medical research. Because of this, the study did not include any more informed consent from these individuals. The study was approved by the Ethics Committee of the First Affiliated Hospital, Zhejiang University School of Medicine (approval no. 20230785), and was performed in accordance with the Declaration of Helsinki.
The inclusion criteria for panoramic radiographs included: permanent dentition; age Ōē¦ŌĆē12. The exclusion criteria included: (1) the deciduous dentition and deciduous teeth were preserved; (2) there was severe crowding of the teeth (greater than 8 mm per arch); (3) incomplete and blurry panoramic radiographs; (4) there was an artifact of spectacles, earrings, piercings and detachable dentures on the panoramic radiographs. Panoramic images were also obtained using a Planmeca Promax Digital Panoramic X-ray (Planmeca, Helsinki, Finland). Tube voltages are between 60 and 90 kV and tube operating currents are between 1 and 10 mA. X-ray exposures were performed using the deviceŌĆÖs default program, which had a fixed magnification of 1.2├Ś and a rotation time of 15.8 s. The resolution of panoramic radiographs was 2943 ├ŚŌĆē1435.
The dataset encompassed 521 panoramic radiographs, with a distribution of 249 male cases (47.8%) and 272 female cases (52.2%). The age spectrum ranged from 12 to 85 years, categorized into five distinct groups: ŌĆē60 years old, with 78 cases (15.0%).
System development
We develop an intelligent diagnosis and statistical analysis system based on panoramic radiographs, as shown in Fig.┬Ā2.
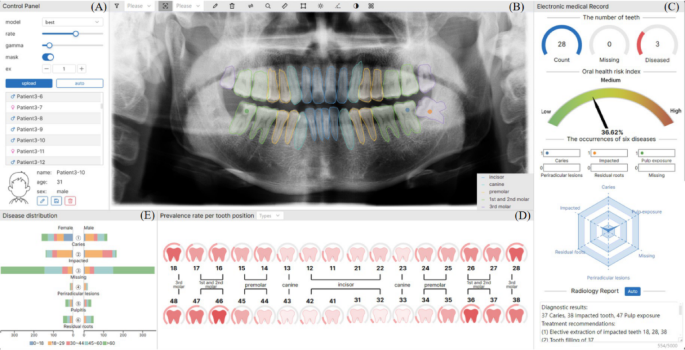
Intelligent diagnosis and statistical analysis system for oral diseases based on panoramic radiographs. (A) A control panel enabling users to load data sets and select the specified patient, whose basic information is presented below. (B) The panoramic view to show the labeled panoramic radiography. (C) The electronic medical record including the number of teeth, oral health risk index, the occurrences of six diseases and radiology report. (D) The heat map to show the prevalence rate per tooth position. (E) The bar view to present the disease distribution.
Interactive capabilities for diagnosing diseases
We used Mask R-CNN for tooth segmentation and tooth position recognition. Next, we selected the ResNet101 model as our initial model. It was pre-trained on the ImageNet dataset, which includes over 14 million labeled images. We then fine-tuned the pre-trained ResNet101 model through transfer learning using our self-annotated dataset of multi-type oral diseases. The dataset consists of 307 panoramic dental radiographs. Each tooth was meticulously annotated by multiple dental experts and categorized into seven classes: healthy, caries, pulp exposure, periradicular lesions, impacted teeth, residual roots and missing teeth. Labels were established by a team of three dentists, each with over 10 years of clinical experience and a background in oral and maxillofacial radiology. When consensus was not reached, a fourth senior radiologist provided final validation. In total, we extracted approximately 531 annotated tooth samples, with 80% used for training and 20% used for testing. During the transfer learning process, we replaced the original fully connected layer of the ResNet101 model with a new one tailored to the current task. The new fully connected layer includes seven output nodes, corresponding to the seven categories, and uses the Softmax function to generate class probabilities. We froze the initial convolutional layers of the model to preserve their pre-trained feature extraction capabilities. At the same time, we fine-tuned the later convolutional layers and the new fully connected layer to adapt the model to the specific characteristics of dental lesions. To improve the modelŌĆÖs robustness and generalizability, a range of data augmentation techniques was employed, including random rotation, horizontal flipping, brightness adjustment, and denoising. These methods enhanced the diversity and quality of the training samples, enabling the model to handle varied clinical scenarios. Additionally, we optimized the training process by performing cross-validation to identify the best hyperparameter settings. As a result, we obtained a ResNet101 model capable of intelligent diagnosis across multiple types of oral diseases.
The system enables dentists to verify and refine the results of automatic tooth segmentation and preliminary disease diagnosis, ensuring accuracy and clinical reliability. After the model segments the teeth and identifies potential diseases, dentists can interactively review the results. They can annotate lesion locations, and modify any inaccuracies in segmentation or diagnosis. By combining automated diagnosis with interactive verification, the system increases diagnostic precision while providing dentists complete authority. This ensures alignment with clinical standards and patient-specific needs.
Generation of electronic medical records
The system generates electronic medical records based on visualization technology and annotated images as the characteristic data. Here are two functional modules below. (Fig.┬Ā2C)
(1)
Visualized charts.
The top line presents the number of teeth information. Following this, using the lesion location data, we assign a corresponding weight to the diseaseŌĆÖs severity. Based on the weight, a health risk chart is designed to represent the health risk index. Lastly, the system counts the occurrences of six diseases from the uploaded panoramic radiographs. A radar chart is employed to visualize this statistical information, with the vertices of the radar chart representing the extreme values of the statistical data.
(2)
Radiology report.
This module primarily involves text matching and generation. We first created a comprehensive oral therapy corpus that included a variety of oral issues, available treatments, and clinical settings. Secondly, we built a rule-based text matching model. It processes disease diagnoses according to preset rules and categorizes key information based on disease type, clinical symptoms, and disease severity. Thirdly, the system integrates structured information to facilitate model matching. It queries the corpus based on the extracted structured information to obtain more detailed information about oral problems and treatments. For instance, the medical record description of a patient with caries can be integrated into the structured information of ŌĆ£17-cariesŌĆØ following the rule of ŌĆ£tooth position +ŌĆēdiseaseŌĆØ. Cosine similarity computation is employed to retrieve relevant treatment suggestions from the corpus. Additionally, we predefined templates for generating oral diagnostic health reports. These templates cover diagnostic descriptions, symptoms, treatment recommendations, and precautions for oral diseases. Ultimately, we standardized and refined the information extracted from the corpus, which produced readable treatment recommendation texts. The final confirmation of the radiology report is made by the treating dentist, who reviews and adjusts the generated content based on clinical examination and patient consultation.
Statistical analysis
Our study further provides a statistical analysis module that employs multi-dimensional attribute images such as heat maps and bar charts. It helps to conduct statistical investigations and visual analyses of group characteristics and disease features (Fig.┬Ā2D and E).
(1)
Prevalence rate per tooth position.
The system organizes and consolidates the gathered data, tallying the occurrences of six oral diseases (caries, pulp exposure, periradicular lesions, impacted teeth, residual roots, missing teeth) in each tooth position. Different shades of red represent the prevalence level and deeper colors indicate a higher number of affected teeth at a certain dental position. Additionally, a dashboard is located above each tooth icon. It displays the probability of the tooth being non-normal (number of affected teeth on site/total number of teeth on site) for all panoramas that have been studied.
Dentists can hover over a tooth position to reveal the number of affected teeth in that position by interacting with the heat map. Utilizing the filtering options in the interaction box (e.g., choosing a specific oral disease or all oral diseases), dentists can refine and tally the data, obtain the filtered information, and redraw the heat map for visualization.
(2)
Disease distribution per tooth position.
When the dentist clicks a tooth icon on the heat map, the system filters the corresponding disease data. After retrieving the age and gender distribution, it shows them on the right as a gender distribution chart and a bar chart. This interaction between the heat map and bar chart facilitates a comprehensive understanding.
(3)
Association of disease with other factors.
Bar graphs are used to illustrate the prevalence of the six oral diseases across various genders and age groups. The vertical axis represents the six oral diseases, while the horizontal axis indicates the number of affected teeth. Each bar corresponds to one oral disease. Its stacked segments represent subgroups based on gender (male or female) or age (ŌĆē60)17.
User study
To further assess the effectiveness of our system, we invited twelve dentists (6 males and 6 females) to use our system. The composition of the dental team includes: 4 high-level dentists with more than 10 years of clinical experience (H1, H2, H3, H4); 4 mid-level dentists with 3ŌĆō10 years of clinical experience (M1, M2, M3, M4); and 4 low-level dentists with less than 3 years of clinical experience (L1, L2, L3, L4). Before teaching them how to use the system, we gave them an overview of its goals and features. Subsequently, they applied this system to everyday clinical consultations. During the process, we recorded their feedback and interactions. Additionally, we asked them to evaluate our system using a 7-point Likert scale based on the post-study questionnaire (Table┬Ā1), focusing on system function, system usability and system design.