Where or how you got the data: Regional Cancer Centres in Sweden.
The tool used to generate the visual: R Script (alluvial package).
This is not beautiful. This is giving me a headache.
What is the name for this kind of chart again?
Don’t any of the cases die? Every T4 regresses?
Impossible to read and understand
What does stage T0 on the left mean?
I’d keep the stages on the same level on both sides so it’s clearer when it’s going up, down , or even. That way you don’t have T2 -> T2 look like an increase, for example
What do the stages T0 through T4 mean? How positive of a development is it if cancer regresses from T2 to T1? Does that negate the need for surgery? What drives the need for surgery?
For those of us with little clinical knowledge about cancer, it’s hard to tell what we are supposed to take away from this.
i guess this is good for total cases but given how many people are T2 to start it makes me wonder (1) selection bias, if T2 are suggested most for this treatment and (2) success as a proportion of stage observations
to the naked eye it looks like t3 has a higher rate of regression than t2, is that true?
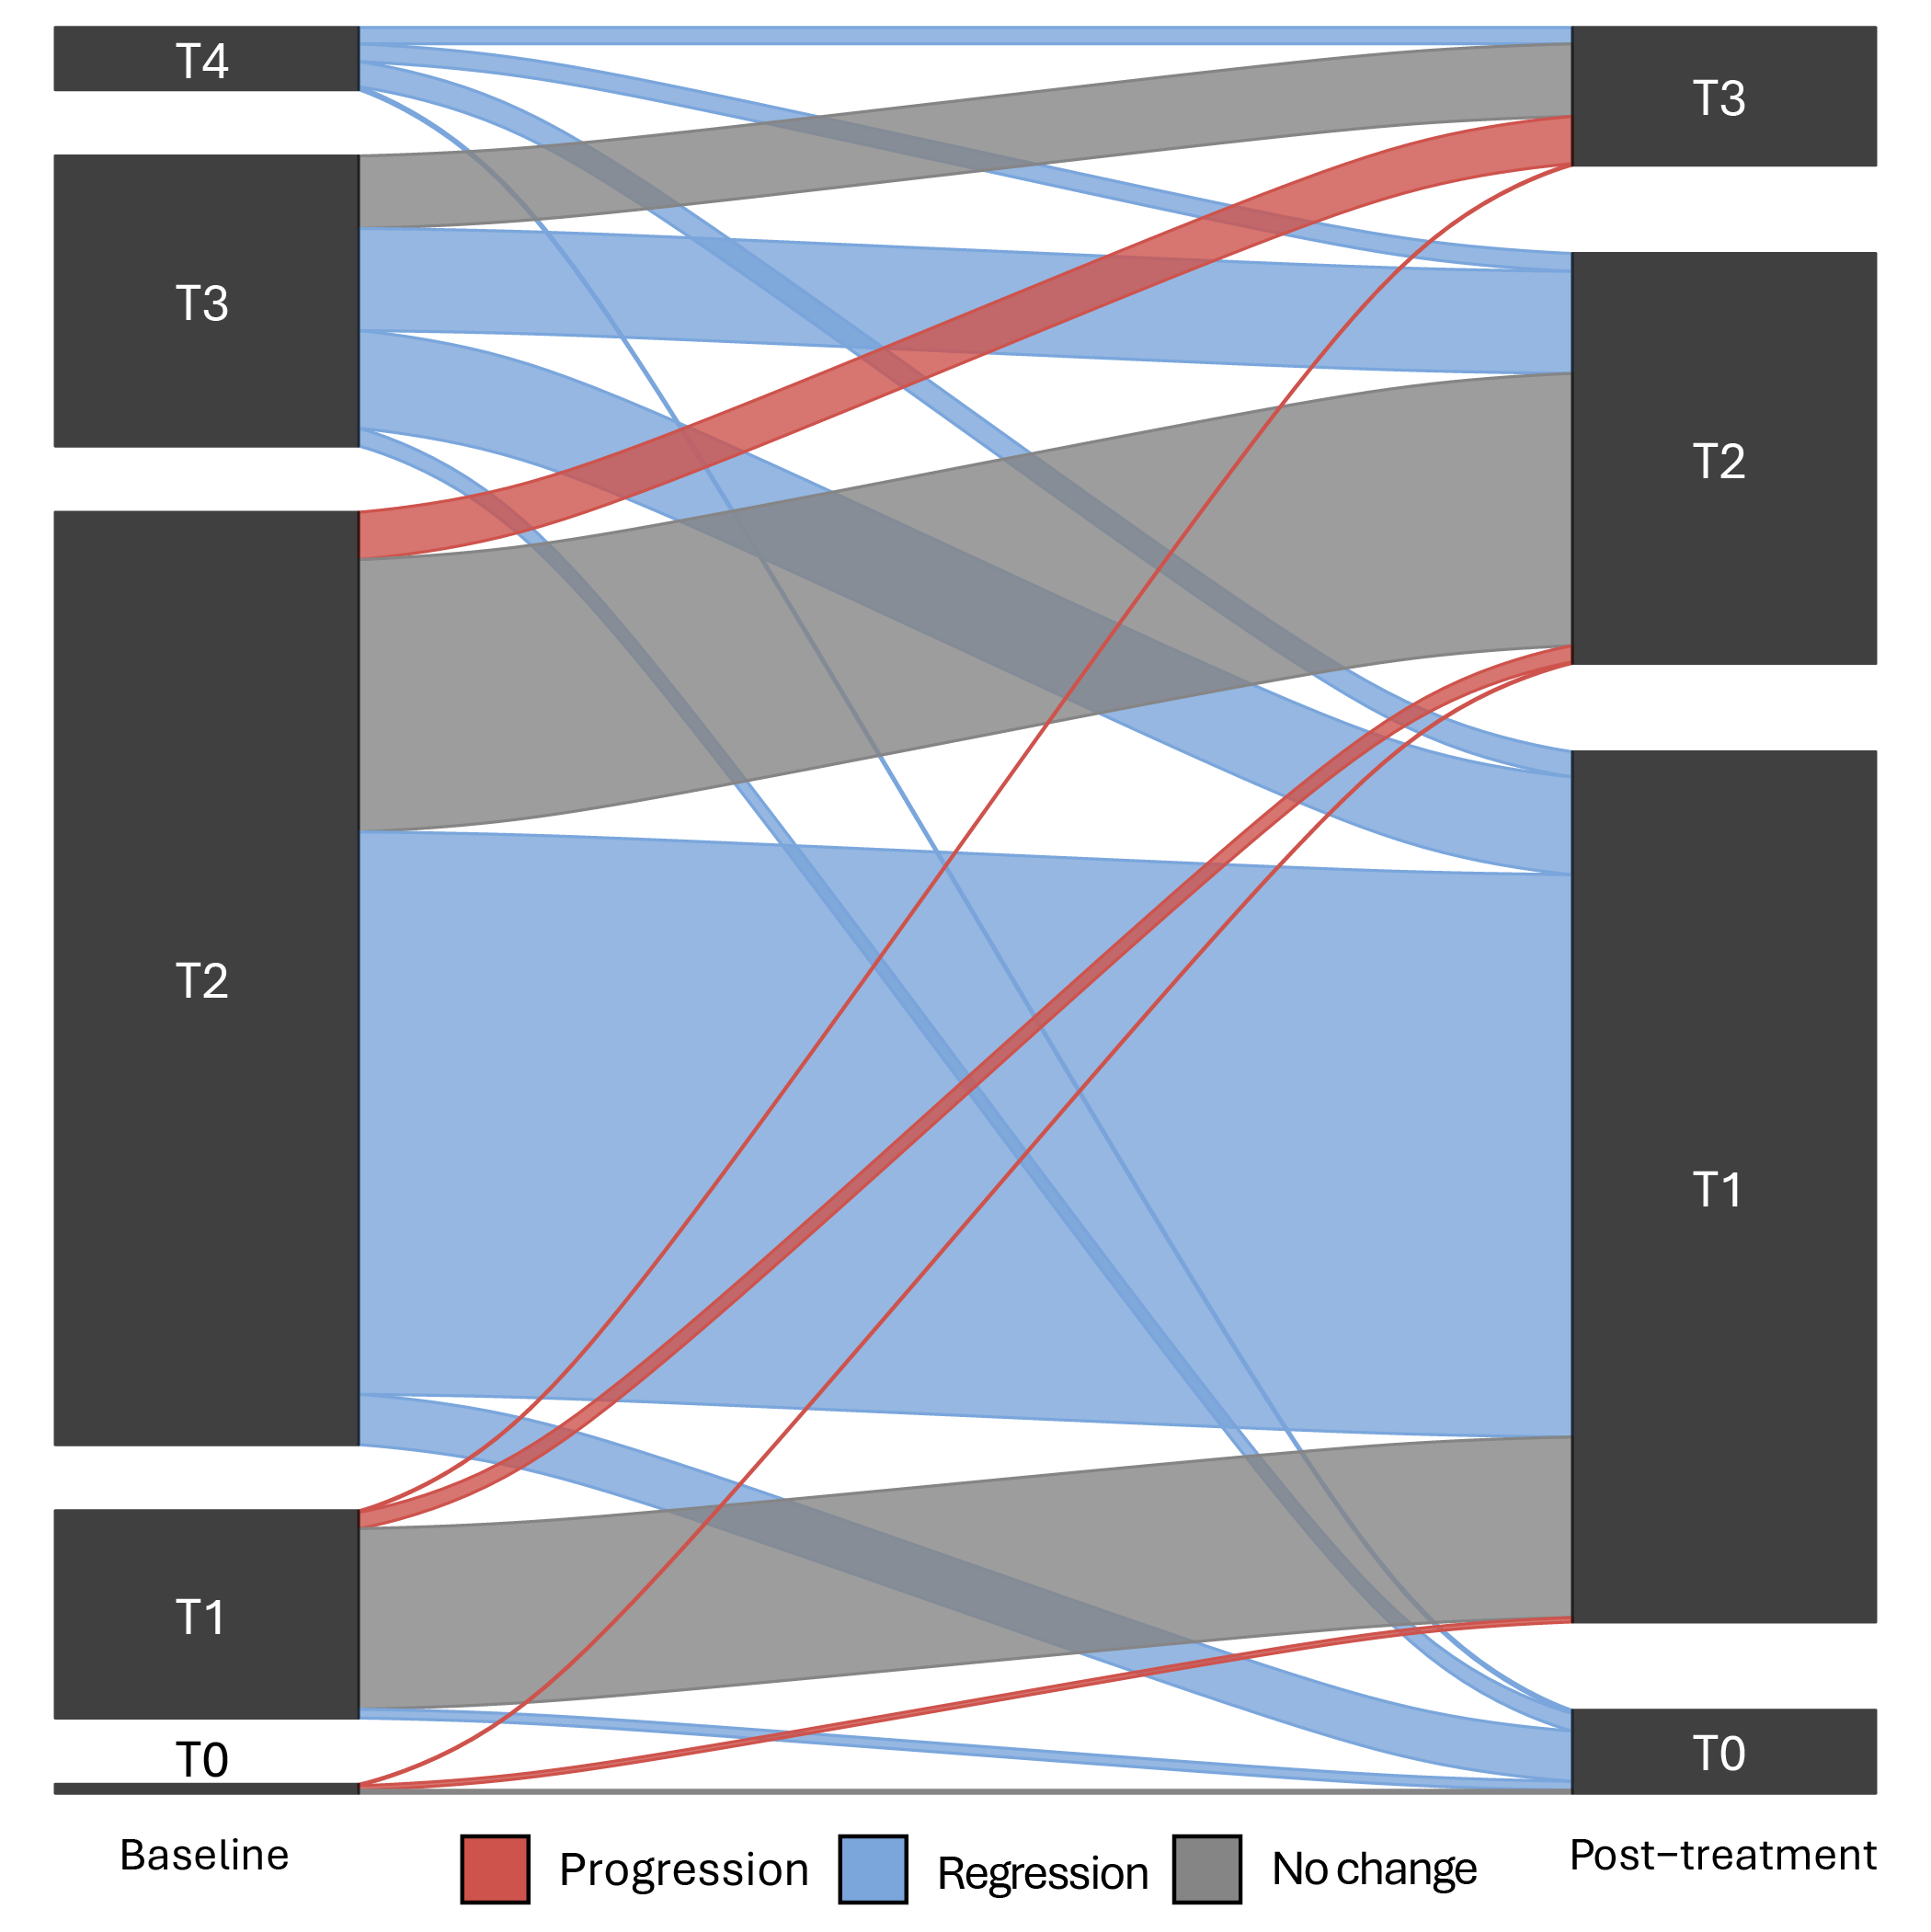
![[OC] Primary tumor-stage (breast cancer), before and after pre-surgery chemotherapy (n=1599).](https://www.europesays.com/wp-content/uploads/2025/06/90xmcu7j3c4f1-1920x1024.png)
10 comments
Where or how you got the data: Regional Cancer Centres in Sweden.
The tool used to generate the visual: R Script (alluvial package).
This is not beautiful. This is giving me a headache.
What is the name for this kind of chart again?
Don’t any of the cases die? Every T4 regresses?
Impossible to read and understand
What does stage T0 on the left mean?
I’d keep the stages on the same level on both sides so it’s clearer when it’s going up, down , or even. That way you don’t have T2 -> T2 look like an increase, for example
What do the stages T0 through T4 mean? How positive of a development is it if cancer regresses from T2 to T1? Does that negate the need for surgery? What drives the need for surgery?
For those of us with little clinical knowledge about cancer, it’s hard to tell what we are supposed to take away from this.
i guess this is good for total cases but given how many people are T2 to start it makes me wonder (1) selection bias, if T2 are suggested most for this treatment and (2) success as a proportion of stage observations
to the naked eye it looks like t3 has a higher rate of regression than t2, is that true?
What I’m particularly confused about is you don’t change cancer stage? https://my.clevelandclinic.org/health/diagnostics/22607-cancer-stages-grades-system
Comments are closed.