![[OC] May 2025 total job postings by City (top 500 cities that posted new jobs)](https://www.europesays.com/wp-content/uploads/2025/06/ja4f03cssg4f1-1600x1024.jpeg)
Data Source:
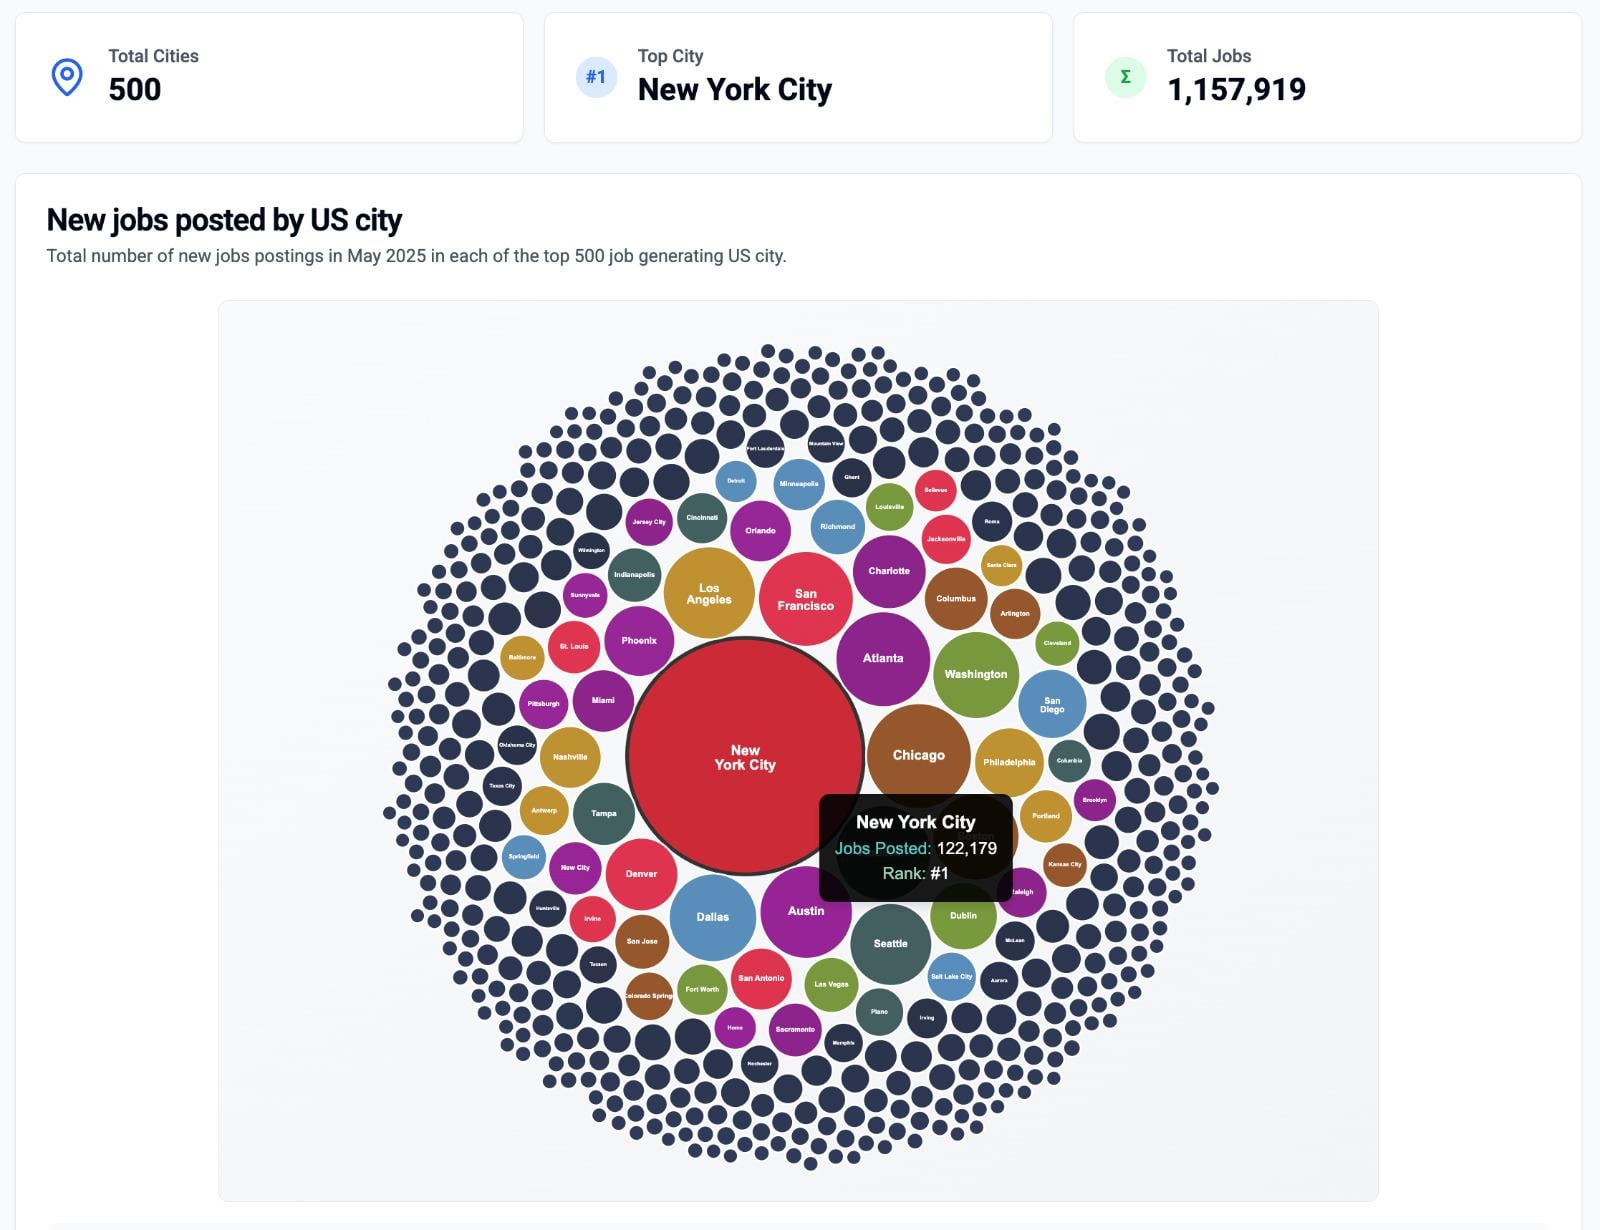
US city job postings data from May 2025, aggregated from job board APIs and employment databases
Tools Used:
D3.js for data visualization and circular packing layout
React.js for component framework
TypeScript for type safety
Custom color palette
Methodology:
Filtered top 500 US cities by job posting volume
Excluded generic locations like "Remote" and "California"
Circle size represents job count using square root scaling
Color coding:
Themed colors for cities >4000 jobs, blue gradient for smaller cities based on distance from center
Interactive tooltips show exact job counts and city rankings
Notes:
Data represents new job postings for May 2025
Minimum threshold applied to ensure data quality
Circle packing algorithm optimizes space utilization while maintaining proportional representation
Posted by aaghashm
12 comments
**Data Source:**
US city job postings data from May 2025, aggregated from job board APIs and employment databases
**Tools Used:**
D3.js for data visualization and circular packing layout
React.js for component framework
TypeScript for type safety
Custom color palette
**Methodology:**
Filtered top 500 US cities by job posting volume
Excluded generic locations like “Remote” and “California”
Circle size represents job count using square root scaling
**Color coding:**
Themed colors for cities >4000 jobs, blue gradient for smaller cities based on distance from center
Interactive tooltips show exact job counts and city rankings
**Notes:**
Data represents new job postings for May 2025
Minimum threshold applied to ensure data quality
Circle packing algorithm optimizes space utilization while maintaining proportional representation
You have the New York blurb covering up 2 cities
Here is another cut of my data for May
https://preview.redd.it/rhj2chx1ug4f1.jpeg?width=1600&format=pjpg&auto=webp&s=e5c32c8a79b373c4d1c140986ef19f62217d30c5
this is great, but why posting with a tooltip over part of the map?
Not a great vizualisation. Who is ahead between SF, Atlanta and Chicago? Also it would be better to have a per capital value instead of the raw number.
Is there a name for this of visualization. I quite like it
Antwerp? Belgium or ??? And Dublin (CA or Ireland)?
Isn’t this just another representation of population? Normalize the data for population and then we can have some interesting data.
Where is Houston on the map?
Would be interesting to see this adjusted per capita
Is it useful to separate cities within Metro areas? I wouldn’t think so for this type of data.
Also I see Springfield has a lot of job postings. Did you just aggregate all Springfields regardless of state?
Perhaps an interesting way to go deeper into this data would be to measure these figures on a per capita basis?
Right now I’m looking at the big NYC bubble and thinking ‘well it’s the most populous city so obviously it has the most job postings’, but it would be interesting to see if the number of job postings per capita tells a different story.
Comments are closed.