This paper aims to obtain tweets related to the topic of “Israel” and “Palestine” posted by X.com users in 192 countries worldwide (excluding Israel and Palestine) from October 7, 2023, to April 3, 2024, for a total of 180 days. Due to X.com restricting queries to a 25-mile radius (X Developer Platform 2023), it was not possible to retrieve all tweets corresponding to each country in a single operation. A group-based sampling approach was employed to determine the number of candidate cities from each country. Specifically, the countries were categorized into five groups based on the national territorial area to determine the number of selected cities. If a country is larger than five million square kilometers, eight cities will be chosen; if it is between one million and five million square kilometers, six cities will be selected; if it is between one hundred thousand and one million square kilometers, four cities will be selected; if it is between one thousand and one hundred thousand square kilometers, two cities will be selected; if it is less than one thousand square kilometers, one city will be selected. By considering factors such as urban economic development and population size, the specific cities for each country were selected.
Cities in Israel were excluded to ensure objectivity in the analysis. Due to a lack of city information, the study area includes only two cities in Timor-Leste (Dili and Baucau). According to the rules for determining the number of cities by country area, 738 cities in 192 countries worldwide were selected as the preliminary study area. The center latitude and longitude coordinates of the cities were obtained from ArcGIS Hub (ArcGIS Data and Maps 2013), and the city area was obtained from Wikipedia (2001). However, since the city area of some cities is not available through Wikipedia (e.g., Kibuye in Rwanda, Labasa in Fiji), the area was manually measured using Google Earth (Google LLC 2017).
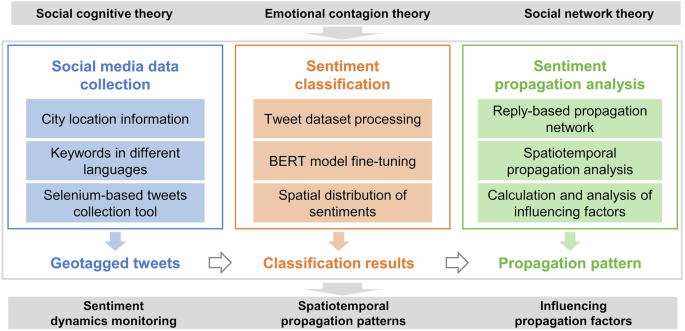
Geotagged tweets were collected using the query keywords “Israel” and “Palestine,” along with their translations in 68 languages. The original tweet text was processed to remove duplicates and redundant elements, such as emojis and URLs, and then translated into English. A total of 83,655 geotagged tweets were collected from 293 cities across 85 countries worldwide. To ensure user privacy, all user-related information, including usernames, was completely removed from the dataset. The final dataset includes only the timestamp, tweet content, and posting location. Please refer to Fig. 2 for the detailed spatial distribution.
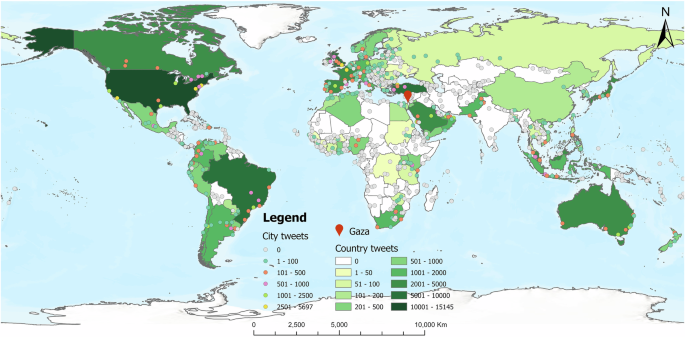
Circles of different colors represent the level of tweet volume from each city. The intensity of each country’s fill color indicates its number of tweets.
After sorting the collected geotagged tweets, it can be found that the top ten countries with the most tweets were the U.S. (15,145), U.K. (6897), Turkey (5520), Brazil (5329), Saudi Arabia (4439), Australia (3884), France (3410), Canada (3262), Japan (2760), and Spain (2391). The top ten cities with the most tweets were London (U.K.) (5697), New York (U.S.) (4513), Istanbul (Turkey) (3843), Washington (U.S.) (3201), Los Angeles (U.S.) (2910), Paris (France) (2898), Tokyo (Japan) (2413), Sao Paulo (Brazil) (2366), Riyadh (Saudi Arabia) (2176), and Kuwait City (Kuwait) (1868). The geographic distribution of tweets in the dataset shows a higher proportion of tweets from users in Western countries (e.g., the United States, the U.K., Australia, and France), highlighting the significant influence of Western discourse on discussions about the Israeli–Palestinian conflict on X.com.
Furthermore, in order to conduct spatiotemporal propagation analysis, the reply tweets based on the original geotagged tweets were collected. After cleaning, a total of 99,536 tweets (original geotagged tweets are 83,655) carried location information, accounting for about 65.74% of the total tweets (151,400).
Sentiment classificationFine-tuning BERT for sentiments classification
The BERT model was fine-tuned on publicly available tweet datasets, which were split into training, validation, and test sets in a 6:2:2 ratio. Subsequently, the fine-tuned model was used to conduct sentiment classification on the collected geotagged tweets. Detailed information about the datasets used in the experiments is as follows:
(1)
Dataset with 2 sentiment categories: Sourced from Go et al. (2009), this dataset includes two labels (0: negative, 1: positive), with volumes of 50,000 for each label.
(2)
Dataset with 3 sentiment categories: Obtained from Hussein (2021), this dataset features three labels (0: negative, 1: positive, 2: neutral) with volumes of 35,503, 72,237, and 55,197 for each label, respectively.
(3)
Dataset with 6 sentiment categories: From Saravia et al. (2018), this dataset contains six labels (0: sadness, 1: joy, 2: love, 3: anger, 4: fear, 5: surprise), with volumes of 121,187, 141,067, 34,554, 57,317, 47,712, and 14,972 for each label, respectively.
Nine experiments were conducted for sentiment classification, covering two categories (positive and negative), three categories (positive, neutral, and negative), and six categories (anger, fear, joy, love, sadness, and surprise). The models used for these classifications included TextCNN, BiLSTM, and BERT. The PyTorch framework was utilized to implement the training, validation, and testing processes for all nine experiments. The source code is publicly available on figshare. Due to the imbalanced distribution of sentiment categories in the publicly available dataset, the weighted F1-score was selected as the evaluation metric. This metric addresses the issue of category imbalance by assigning weights to the F1-score of each category, offering a more balanced evaluation of the model’s performance across all sentiment categories. The results are presented in Table 1 and Fig. 3. As shown in Table 1, the proposed method outperforms all other models across all datasets (2, 3, and 6 categories of sentiments). In the 6-category experiment, the proposed method achieved a weighted accuracy of 94.19% and a weighted F1-score of 94.35%, whereas the performance of TextCNN and BiLSTM remained below 93%. Notably, the weighted F1-score of the proposed method in the 3-category experiment is higher than in the 6-category experiment, primarily due to differences in the fine-tuning datasets; the “neutral” sentiment significantly overlaps with the fine-grained sentiments present in the 6 categories.
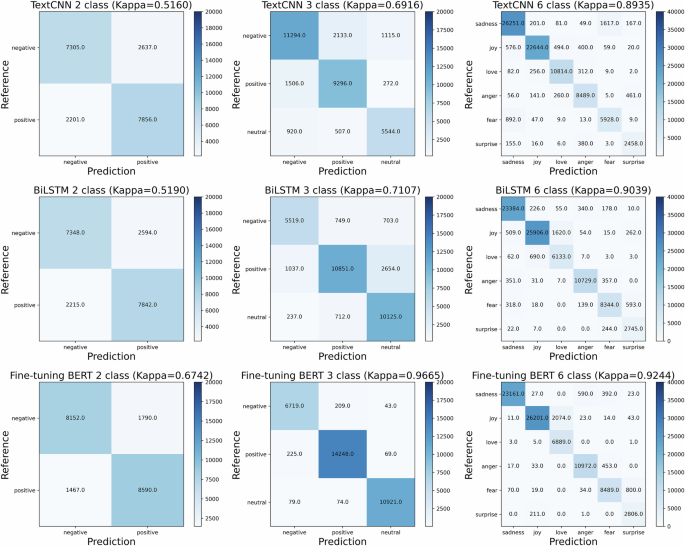
The darker the color on the diagonal, the more samples the model correctly predicts, indicating better classification performance.
In Fig. 3, the true sentiments (i.e., References) and the classified sentiments (i.e., Predictions) are compared using a confusion matrix, where a higher value (or deeper color) along the diagonal indicates greater consistency between References and Predictions. The proposed method in the 6-category experiment demonstrates a clear distinction across all sentiments, as evidenced by the diagonal positioning. In contrast, the 3-category experiment shows a higher percentage of inconsistent sentiment results. In the 6-category experiment, inconsistencies primarily occur among the sentiment pairs “sadness”-“anger”-“fear” and “joy”-“love”. Given that opinions expressed about military conflicts predominantly reflect “sadness”, “anger”, “fear” and “surprise”, the 3-category fine-tuned BERT tends to broadly classify sentiments as either “negative” or “neutral”. Therefore, the 6-category fine-tuned BERT is better suited for sentiment classification of geotagged tweets regarding the Israeli‒Palestinian conflict.
Spatial distribution of sentiments
Using the fine-tuned BERT model, 83,655 geotagged tweets from 293 cities were processed to identify their sentiments. Then, the spatial distribution of these sentiments was visualized. To analyze the six basic sentiments expressed by X.com users across various regions worldwide, the world was divided into 17 geographic regions (United Nations Statistics Division 1999). A violin plot was employed to illustrate the distribution of sentiments of tweets across these different geographic regions.
As shown in Fig. 4, a map is designed to present the spatial distribution of sentiment classification results. The findings indicate that “surprise” predominates across various countries and regions worldwide, while “anger” and “fear” sentiments are primarily observed in Europe and Africa. Although “love” is typically viewed as a positive sentiment in this context, it is found in relatively large proportions globally, suggesting that people are expressing sympathy for those suffering from wars and conflicts. Conversely, the sentiment of “joy” is rarely observed, highlighting that the opinions expressed by users are not anti-human in nature.
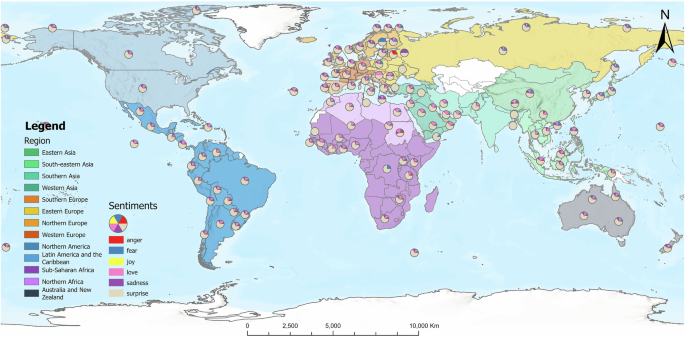
Countries within the same geographic region share the same color. The proportions of six sentiment categories for each country are illustrated using pie charts.
To further investigate sentiment differences at various scales, the number of tweets with different sentiments were analyzed regionally. Figure 5 shows that “surprise” consistently dominated at the regional scale, while “love”, “sadness” and “fear” occurred with similar frequencies. In contrast, the appearances of “anger” and “joy” were minimal. Notably, tweets were not collected from regions such as Central Asia, Micronesia, Polynesia, and Melanesia, and the number of tweets in regions such as Northern Africa, Eastern Europe, and Southern Asia was low. This may be due to the relatively low popularity of X.com in these areas.
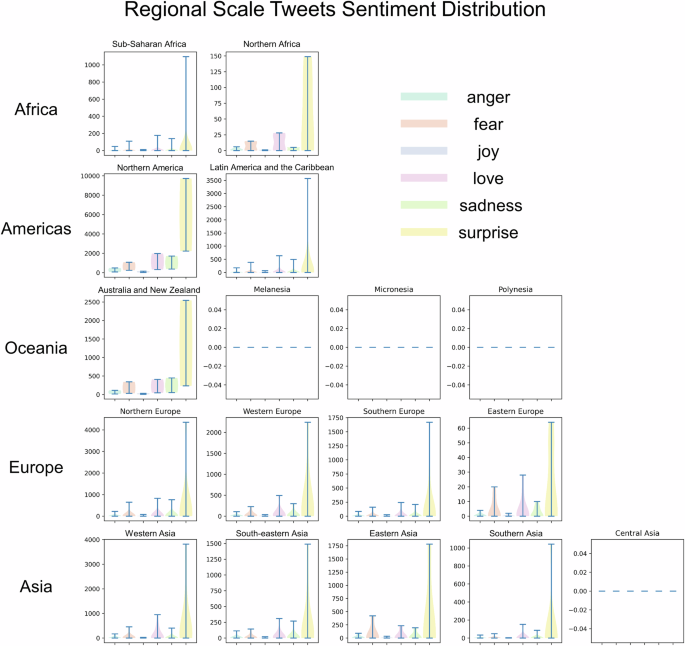
Surprise emotion invariably holds a dominant position across regions.
Moreover, the analysis results may include bias introduced by X.com’s recommendation algorithms. As stated by X.com, safety is a core principle of the platform. During significant events, including but not limited to crises and elections, X.com often implements additional measures to prevent the unintentional amplification of potentially misleading or harmful content. Given the focus of this study, the collected tweets related to the Israeli–Palestinian conflict may be incomplete. For instance, X.com may remove hate speech, which could significantly impact the spread of negative emotions, such as anger and fear.
Spatiotemporal propagation analysisSentiment exchange patterns between users
To explore sentiment exchange patterns between users, a sentiment propagation network was constructed based on the collected tweets and their corresponding reply tweets. The geotagged tweets collected in this study were original posts made by users. These tweets represent users’ initial reactions to breaking events, typically reflecting their personal observations or feelings, rather than being influenced by platform recommendation algorithms. As a result, the constructed sentiment propagation network is less affected by such algorithms. In total, the network includes 99,536 geotagged tweets. The geolocation information is also embedded, supporting the analysis of sentiment exchange patterns from a geographical perspective.
The Fast Unfolding algorithm was applied to detect communities within the sentiment propagation network (Blondel et al. 2008). This algorithm was implemented in Gephi, an open-source network analysis software, with the resolution parameter set to 1.0. Within each community, nodes are densely connected, indicating stronger internal relationships, while connections to nodes in other communities are relatively sparse. The visualization of the sentiment propagation network was generated using the ggraph package in R. Figure 6 illustrates the network’s detailed structure. In this network, each node represents a tweet with country information, while node size reflects the degree of connections. Each edge denotes a reply relationship between tweets, with edge weight indicating the number of reply tweets. Nodes sharing the same color belong to the same community, and the color of the node labels indicates the geographic region of each node.
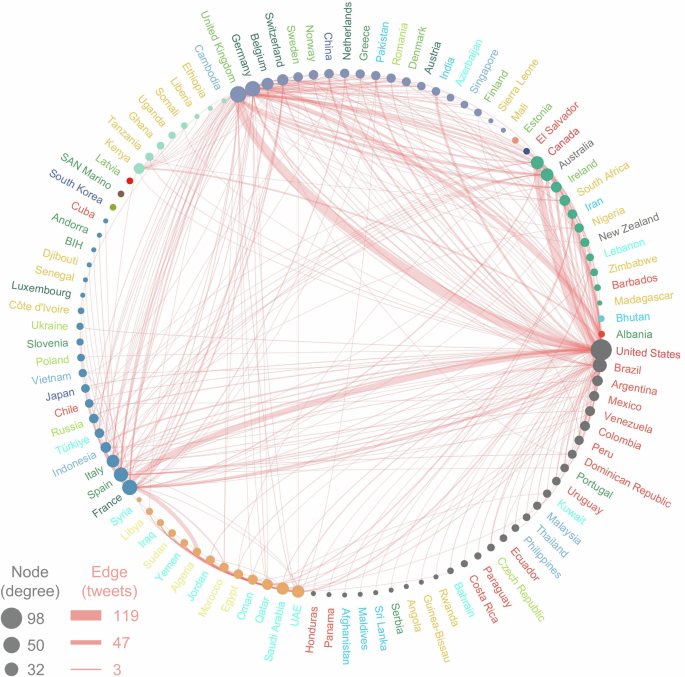
Each node represents a country, with its size indicating its degree. Each edge represents the reply interactions between countries, with its thickness indicating the intensity of communication.
The network reveals three primary node groups: the US-group, the France-group, and the UK-group (Fig. 6). Each group has seen significant internal exchanges among its members, while other groups tend to derive information from them. Indonesia and Turkey stand out in the France-group. This suggests that these two countries share similar characteristics or attributes within the structure of the sentiment propagation network. One possible explanation is that both countries have large Muslim populations, which may influence their sentiment patterns. The UAE-group also holds a significant portion in the network; countries in this group are geographically close to Israel and Palestine and focus more on internal opinion exchange, with less interaction with other groups. This could be attributed to the linguistic, cultural, and religious similarities among countries within the region. Another identifiable group in the network is the Canada‒Australia group, which exchanges opinions with the previous three groups, though at a lower volume. These countries—Canada, Australia, South Africa, and New Zealand—all inherited British colonial legacies, which established enduring similarities in culture, religion, and language. These shared traits, in turn, promote consistent sentiment exchange patterns between users.
Table 2 details the division of countries within each community, indicating that X.com users are more inclined to engage in sentiment exchanges with others in similar geographic regions. For instance, the United Kingdom, Germany, Belgium, Switzerland, and Sweden are clustered together in Cluster 2, while Kenya, Tanzania, Ghana, Uganda, Somalia, Ethiopia, and Liberia form Cluster 3. European countries account for 85% of the edge ratio (i.e., sentiment exchange) in Cluster 2, whereas African countries comprise over 96% of the edge ratio in Cluster 3. Additionally, Clusters 4, 5, and 6 represent distinct regions (Europe at 72.84%, Asia at 74.11%, and Americas at 84.84%, respectively). These clustering patterns may stem from shared economic, religious, and cultural factors that facilitate sentiment exchanges. Notably, Cluster 1 lacks dominant regions, with edge ratios being relatively even across the five regions, which may also explain the characteristics of the Canada‒Australia group mentioned earlier.
Spatial propagation patterns of sentiments
The inflow and outflow of geotagged tweets posted by X.com users regarding the “Israel and Palestine” were analyzed for both internal propagation (within countries) and external propagation (between countries). As shown in Fig. 7, approximately 80.2% of sentiment propagation is internal, while 19.8% is external. Internal propagation primarily occurred in the United States, Brazil, Turkey, and various European countries, whereas external propagation mainly took place between the United States and European countries. The greater volume of internal propagation compared to external indicates that opinions are exchanged more frequently within domestic contexts.
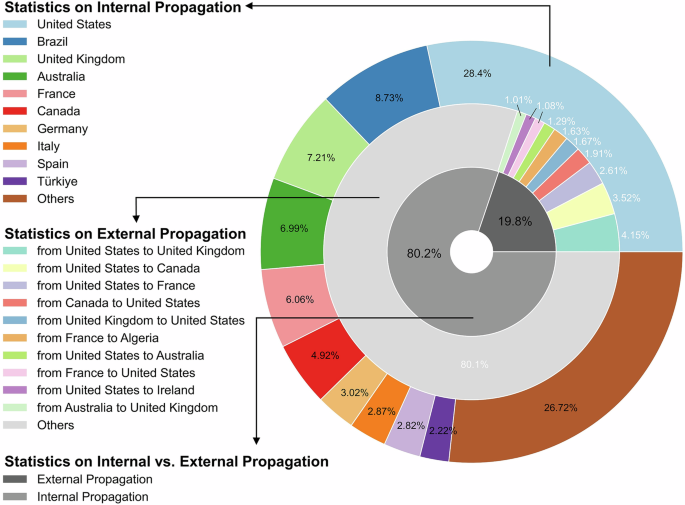
The three concentric pie charts represent, from inside to outside, overall, external, and internal propagation statistics.
Most of the top-ranked countries exhibiting significant internal propagation, such as the United States, United Kingdom, Australia, and France, also lead in external propagation. This suggests that sentiments related to the Israeli‒Palestinian conflict on social media are notably influenced by these nations. Conversely, tweets from Brazil and Turkey show a higher degree of internal than external propagation, potentially reflecting their unique religious and political stances, particularly in the case of Turkey. The most prominent external propagation occurs between Northern America and Europe, with the United States maintaining particularly strong communication ties with both the United Kingdom and Canada (Figs. 6 and 7), likely due to their shared cultural and linguistic roots, common religious traditions, and similar levels of economic development.
In addition, sentiment propagation is more prominent both within and outside Western countries, a pattern that aligns with the distribution of collected geotagged tweets in Section “Tweet dataset preparation”. This partly reflects the dominance of Western discourse on X.com. This phenomenon can largely be attributed to the high proportion of X.com users in Western countries, as well as the level of economic development and well-established Internet infrastructure, which contribute to users’ willingness to engage in international topics. As a result, Western countries dominate the spatial propagation of sentiment.
Figure 8 illustrates the detailed propagation routes of the six sentiment categories. The thickness of the routes indicates the number of tweets, reflecting the intensity of the sentiment propagation. External sentiment propagation is notably concentrated between Northern America and Europe (particularly in Northern and Western Europe). Among the sentiments, “surprise”, “anger” and “love” are propagated more widely, while “sadness” shows notable propagation between Europe and Brazil. In contrast, the sentiment “joy” accounts for a significantly smaller proportion and has a very concentrated propagation scope.
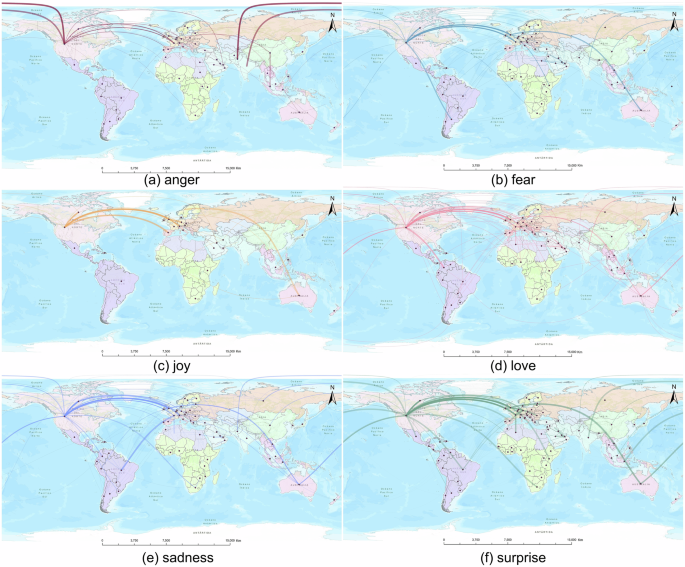
a Anger, b fear, c joy, d love, e sadness, and f surprise.
Temporal propagation patterns of sentiments
The study visualized the time trends of six different sentiments. The results showed that the sentiments expressed by X.com users regarding the Israeli‒Palestinian conflict evolve over time as the conflict progresses. As shown in Fig. 9a, the daily number of tweets categorized by sentiment is illustrated. The “surprise” sentiment accounts for the largest proportion, indicating that most users were shocked by news related to the conflict. This “surprise” sentiment continues to dominate, suggesting the ongoing escalation of the conflict. Following “surprise”, the “love” sentiment ranks second, reflecting the widespread sympathy for hostages, refugees, and civilians affected by the conflict. “Sadness” and “fear” are nearly equal in frequency, both surpassing “anger”, which suggests that users’ focus is more on the humanitarian impact of the conflict than on blaming any particular side. Understandably, there are almost no expressions of “joy” regarding the situation.
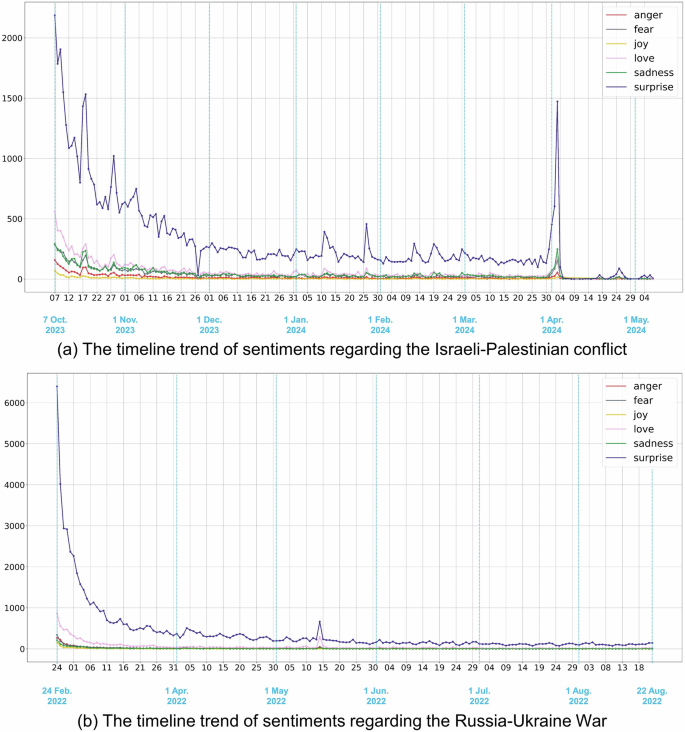
a Israeli‒Palestinian conflict and b Russia‒Ukraine War.
The overall trend of sentiments expressed in tweets shows a decline, though several local peaks are observed in the timeline. The first peak occurred on October 17, 2023, following an explosion at the Al-Ahli Arab Hospital (Reuters 2023), where thousands of displaced Palestinians had sought shelter. The second peak was on October 27, 2023, when Israeli forces reportedly carried out the heaviest ground incursions and intense bombardments in Gaza since the initial conflict began on October 7 (UN News 2023). Both events drew global attention to the unfolding humanitarian crisis. Another notable peak occurred around April 3, 2024, when seven World Central Kitchen (WCK) aid workers were killed (CNN 2024), sparking widespread condemnation and pushing the “sadness” sentiment to second place. As illustrated in Fig. 9a, the timeline of sentiments closely mirrors real-world events.
Moreover, the Russia‒Ukraine War was selected as a case for comparative analysis. A total of 86,650 geotagged tweets were collected using “Russia” and “Ukraine” as query keywords in 68 different languages. The tweets were collected between February 24, 2022, and August 22, 2022. The time trends of six sentiments—anger, fear, joy, love, sadness, and surprise—during the Russia‒Ukraine War are visualized in Fig. 9b. The results revealed that “surprise” remained a prominent sentiment throughout the war, though the overall sentiment trend remained relatively flat without significant fluctuations. This suggests that public sentiment toward the Russia‒Ukraine War stabilized over time.
By comparing the time trends of different sentiments in the two conflicts, it is evident that users’ sentiments exhibit diverse patterns, ranging from gradual flattening to dramatic fluctuations in response to unexpected events. We speculate that these variations arise because individuals worldwide react differently to military conflicts based on their unique backgrounds, including economic, religious, educational, and other personal factors. Further analysis is needed to explore the main factors influencing the spatiotemporal propagation of tweets.
Main factors influencing sentiment propagation
According to social cognition theory and emotional contagion theory, sentiment propagation between groups is significantly influenced by individual cognition and the external environment (Bandura 1988; Christophe and Rimé 1997). Several factors can affect the propagation of sentiments regarding the Israeli–Palestinian conflict on X.com. Religious beliefs shape individuals’ values, influencing their sentiments toward major events (Stoudenmire 1971). Higher education levels enhance individuals’ critical thinking and information processing abilities, impacting their trust in information and willingness to share it, thereby shaping sentiment transmission. A country’s level of economic development also plays a crucial role in influencing the external environment in which individuals operate. Additionally, the size of a group affects sentiment propagation, with larger populations providing more potential disseminators, thus accelerating the spread of sentiment (Smith and Conrey 2007). It is evident from previous studies that these factors are closely related to sentiment propagation, social interaction, and information communication.
To analyze the relationship between the spatiotemporal propagation of sentiments and the key influencing factors, this study developed a workflow. The workflow began with unsupervised clustering, followed by supervised classification, and concluded with feature importance calculation. The specific steps are as follows:
(1)
First, the experimental datasets, which include time series data of tweets with different sentiments and national-level indicator data, were collected. The time series of tweets represents the daily count of tweets with varying sentiments for each country. First-order differencing was applied to improve the stationarity of the time series. Factor-related data, as shown in Table 3, were gathered to provide detailed insights into population, economy, education, religion, and Internet usage across countries. Most of this data is from 2023, which aligns well with the study’s time frame. Although the “Individuals using the Internet” data is from 2022 and the “Religious population” data is from 2020, these values remain reasonable when viewed from a regional comparison perspective.
(2)
The next step is unsupervised clustering. The world is divided into 13 different geographic regions based on the United Nations’ classification (United Nations Statistics Division 1999). The unsupervised clustering method is applied to the time series of tweets with varying sentiments and national-level indicator data for each geographic region. The clustering results serve as labels for the Random Forest classification.
To select an appropriate time-series clustering method and distance function, K-Means and K-Medoids methods were used in conjunction with Euclidean distance (ED) and dynamic time warping (DTW). As shown in Fig. 10, four sets of experimental results were generated. Figure 10a presents the silhouette scores, where higher values indicate better clustering quality. The results show that the K-Means and ED combination performs better, especially when the cluster count is set to 2, 3, 4, or 5. According to the definition of SSE (Sum of the Squared Error), SSE decreases as the cluster count increases, and the appropriate number of clusters is determined when the rate of SSE reduction changes significantly. Figure 10b shows that cluster count of 5 is suitable.
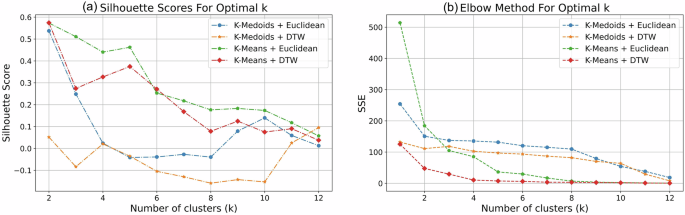
a K-Means with ED achieves higher silhouette scores, especially for 2 to 5 clusters. b SSE results stabilize when the number of clusters reaches 5, indicating that five clusters are optimal.
Therefore, the optimal number of clusters was determined to be 5, and the clustering results are presented in Fig. 11. Countries within the clusters were clearly distinguished on the map, and the distribution of these clusters aligns well with geographic characteristics. For instance, Western Asia and Northern Africa are grouped together. We speculate that this phenomenon is due to the large Muslim population in these regions, in which a shared religious, cultural, and linguistic background contributes to similarities in the spatiotemporal patterns of sentiment propagation. Additionally, Northern America, Europe, Australia, and New Zealand are grouped together. This may be attributed not only to the relatively advanced economies in these regions, which encourage a greater willingness to comment on international affairs, but also to the cultural and linguistic commonalities shared among them, as summarized in Sections “Sentiment exchange patterns between users” and “Spatial propagation patterns of sentiments”. As a result, the spatiotemporal patterns of sentiment propagation among X.com users in these regions exhibit similarities.
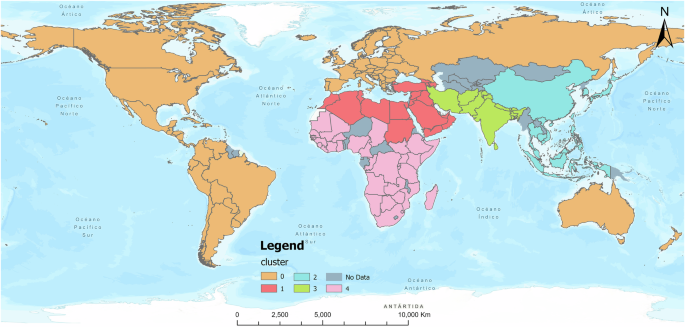
Countries sharing the same fill color belong to the same category.
(3)
The final step is the feature importance calculation based on Random Forest. The clustering results from step (2) assign different labels to each country. Random Forest classification is then performed using national-level indicator data and these labels. Since this experiment focuses on analyzing the impact of indicator data on the Random Forest decision tree structure, MDI (Mean Decrease in Impurity) is selected as the feature importance calculation method to evaluate the relationship between national-level indicators and the spatiotemporal propagation patterns of sentiment.
In the Random Forest classification, grid search combined with five-fold cross-validation was used to determine the optimal model parameters. The optimal parameter settings are as follows: the maximum depth of the trees is set to 5; the maximum number of features considered at each split is not limited (i.e., None); the minimum number of samples required for both a leaf node and an internal node to be split is set to 2; the number of trees in the random forest is 50, and bootstrap sampling is enabled. During the five-fold cross-validation, the weighted F1-score is used as the evaluation metric for selecting the optimal parameters. The weighted F1-score obtained through five-fold cross-validation reaches 77.75%.
The results of feature importance calculation based on MDI for seven indicators are presented in Table 4. Notably, the “Christian population” ranks first, and the “Muslim population” ranks third. This suggests that religious types significantly influence the spatiotemporal propagation patterns of public sentiment across different countries. Additionally, “GDP per capita” ranks second, and “Individuals using the Internet” ranks fourth, indicating that a country’s level of economic development, as an important factor of external environment, has a moderate influence on sentiment spatiotemporal propagation. We speculate that users on X.com in more economically developed regions tend to benefit from better Internet service accessibility, leading to a higher posting frequency and increased activity in sentiment propagation. In contrast, factors such as “Total Population” and “Government expenditure on education” have relatively minor influences on the spatiotemporal propagation patterns of sentiment.
To further analyze the impact of mainstream and non-mainstream religions on the spatiotemporal propagation of sentiments, this study conducted experiments using the same technical workflow. The mainstream religion refers to the population of the largest religious group in a country, while non-mainstream religions refer to the populations of all other religious groups, excluding the largest. The optimal parameter settings for feature importance calculation of six indicators are as follows: the maximum depth of the trees is set to 7; the algorithm considers only the square root of the total number of features for splitting at each node; the minimum number of samples required to form a leaf node is set to 1, and the minimum number of samples required to split an internal node is set to 2; the number of trees in the Random Forest is set to 100, and bootstrap sampling is disabled. The weighted F1-score obtained through five-fold cross-validation is 65.45%.
The results of feature importance calculation (see Table 5) indicate that the “Non-mainstream religious population” (ranked fourth) and “Mainstream religious population” (ranked fifth) have weaker associations with the spatiotemporal propagation of sentiments, whereas “Individuals using the Internet” (ranked first) and “GDP per capita” (ranked second) are strongly associated with the spatiotemporal propagation of sentiments.