
Gold price (XAU/USD) retreats sharply from a one-week high, around the $3,377-3,378 region touched earlier this Thursday, and dives to a fresh daily low during the first half of the European session. A modest US Dollar (USD) recovery from its lowest level since April 22 turns out to be a key factor that prompts some intraday selling around the commodity. However, persistent trade-related uncertainties and rising geopolitical tensions might continue to act as a tailwind for the safe-haven precious metal.
In fact, US President Donald Trump’s fresh tariff threats, to a larger extent, offset the optimism led by a positive outcome from the high-stakes US-China trade talks. Moreover, bets that the Federal Reserve (Fed) would lower borrowing costs further in 2025 should keep a lid on any meaningful USD appreciation and contribute to limiting the downside for the non-yielding Gold price. Traders now look forward to US macroeconomic releases for short-term opportunities later during the North American session.
Daily Digest Market Movers: Gold price turns lower amid a modest USD recoveryUS President Donald Trump flared up trade tensions on Wednesday, saying that he would set unilateral tariff rates and inform trading partners within two weeks. This adds a layer of uncertainty and overshadows the optimism led by a positive tone following US-China trade talks in London.The US ordered some staff to depart its Baghdad embassy and allowed military families to voluntarily leave the Middle East amid rising security risks. This comes after Iran’s Defence Minister Aziz Nasirzadeh threatened to strike US bases in the region if conflict erupts over its nuclear program.Russia intensified bombardments that it said were retaliatory measures for Ukraine’s recent attacks. A new concentrated wave of drone attacks on Ukraine’s second-largest city of Kharkiv was reported early on Thursday. This keeps geopolitical risks in play and underpins the safe haven Gold price.On the economic data front, the US Bureau of Labor Statistics (BLS) reported on Wednesday that the headline Consumer Price Index (CPI) rose less than expected, to the 2.4% annualized pace in May from 2.3% in the previous month. The consensus estimate was for a reading of 2.5%.Meanwhile, the core gauge, which excludes volatile food and energy prices, matched April’s increase and climbed 2.8% during the reported month. Traders are now pricing in a 70% chance that the Federal Reserve will cut interest rates in September, dragging the US Dollar to a fresh monthly low.The market focus now shifts to Thursday’s US economic docket – featuring the release of the Producer Price Index (PPI) and Weekly Initial Jobless Claims later during the North American session. Nevertheless, the fundamental backdrop suggests that the path of least hurdle for the XAU/USD pair is to the upside.Gold price could attract dip-buyers and find decent support ahead of the $3,300 mark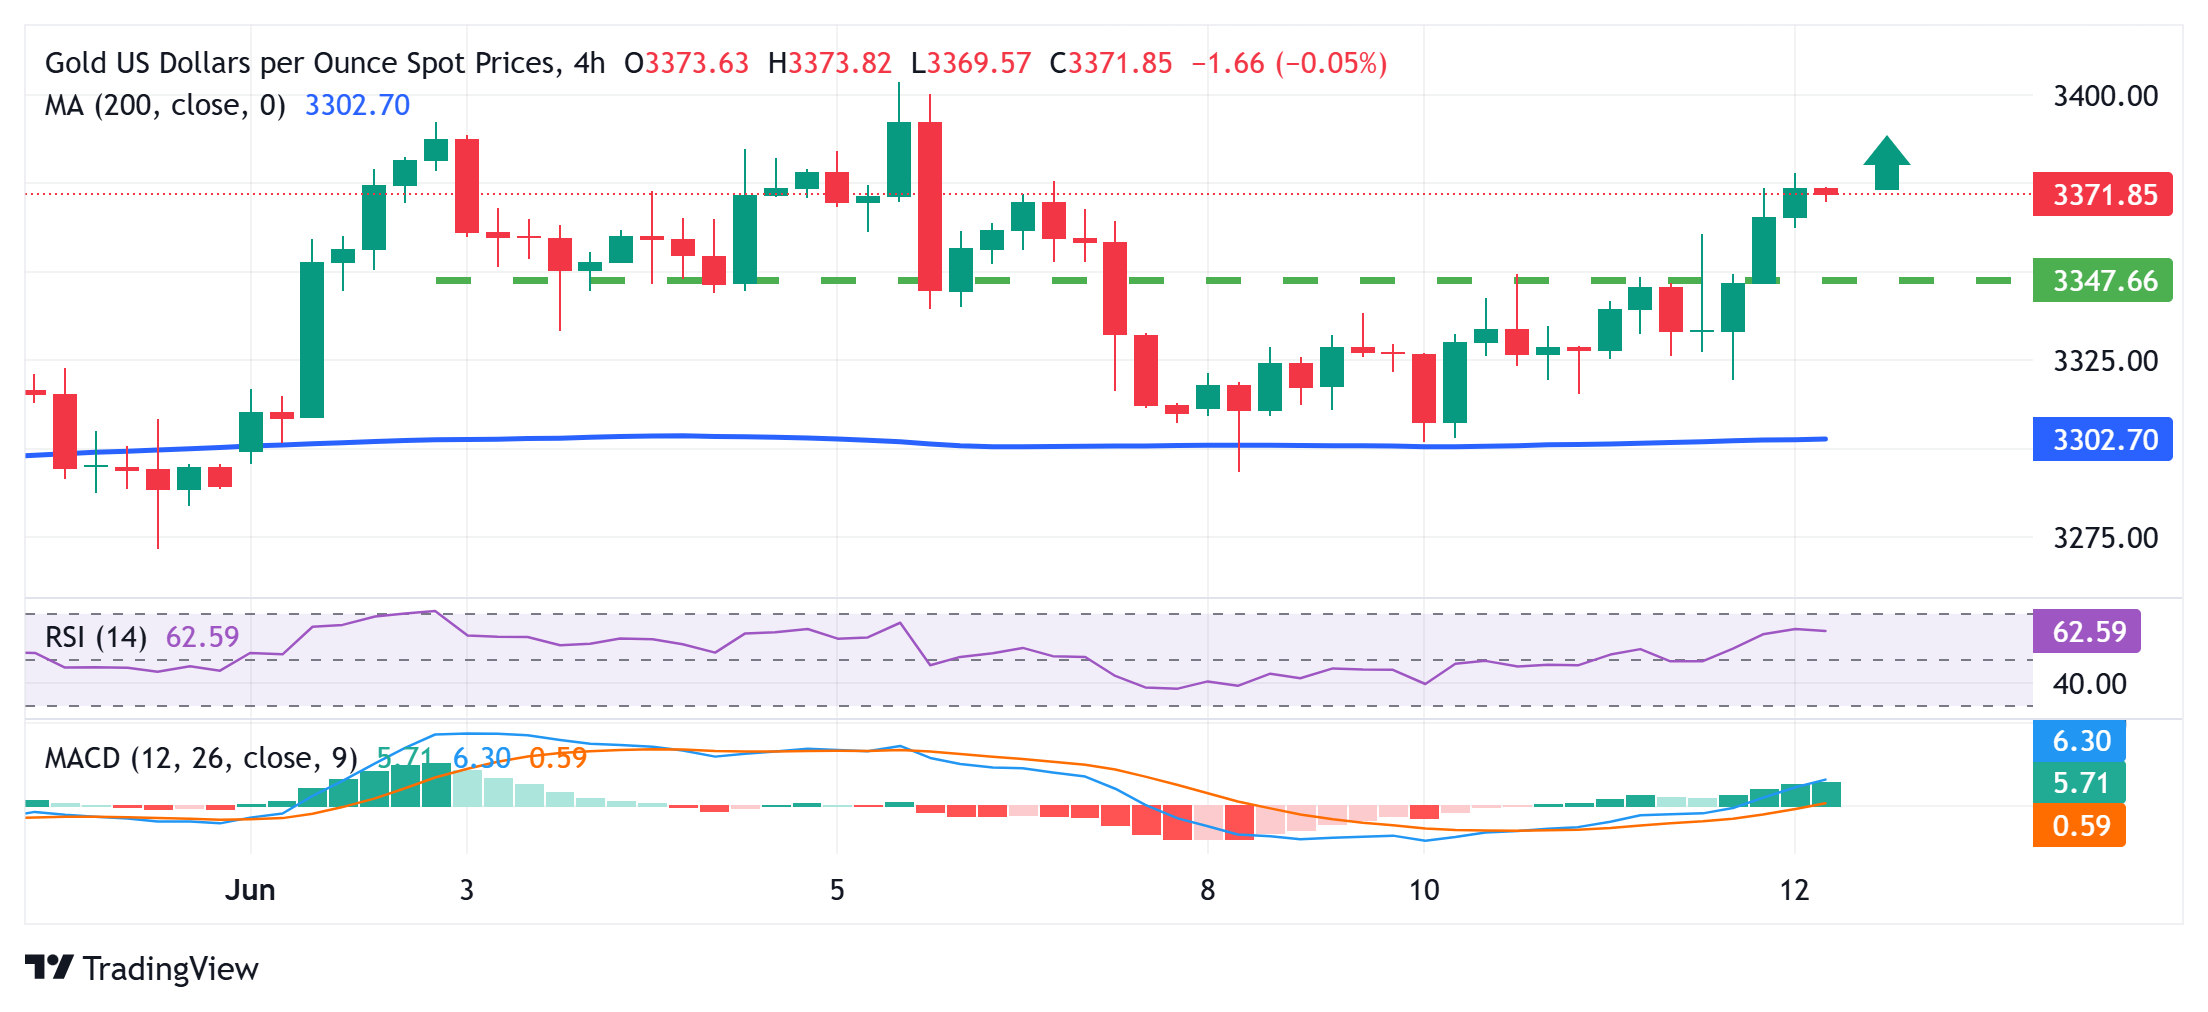
From a technical perspective, this week’s rebound from the 200-period Simple Moving Average (SMA) and the subsequent strength beyond $3,348-3,350 horizontal resistance favors the XAU/USD bulls. This, along with positive oscillators on daily/hourly charts, validates the near-term constructive outlook and should allow the Gold price to climb further towards reclaiming the $3,400 round figure. Some follow-through buying should pave the way for an extension of the momentum to the $3,430-3,435 region, above which the commodity could aim to retest the all-time peak, around the $3,500 psychological mark touched in April.
On the flip side, the aforementioned resistance breakpoint, around the $3,350-3.348 area, now seems to protect the immediate downside. Any further pullback could be seen as a buying opportunity near the $3.323-3,322 region. This should help limit the downside for the Gold price near the $3,300 round figure, or the 200-period SMA on the 4-hour chart. The latter should act as a pivotal point, which if broken would shift the near-term bias in favor of bearish traders.
The Producer Price Index released by the Bureau of Labor statistics, Department of Labor measures the average changes in prices in primary markets of the US by producers of commodities in all states of processing. Changes in the PPI are widely followed as an indicator of commodity inflation. Generally speaking, a high reading is seen as positive (or bullish) for the USD, whereas a low reading is seen as negative (or bearish).
Read more.