
USD: Jun ’25 is Down at 97.840.
Energies: Jul ’25 Crude is Down at 66.81.
Financials: The Sep ’25 30 Year T-Bond is Higher by 18 ticks and trading at 113.27.
Indices: The Jun ’25 S&P 500 emini ES contract is 128 ticks Lower and trading at 5997.50.
Gold: The Aug’25 Gold contract is trading Up at 3403.60.
Initial conclusion
This is not a correlated market. The USD is Down and Crude is Down which is not normal, but the 30 Year T-Bond is trading Higher. The Financials should always correlate with the US dollar such that if the dollar is Higher, then the bonds should follow and vice-versa. The S&P is Lower and Crude is trading Lower which is not correlated. Gold is trading Higher which is correlated with the US dollar trading Down. I tend to believe that Gold has an inverse relationship with the US Dollar as when the US Dollar is down, Gold tends to rise in value and vice-versa. Think of it as a seesaw, when one is up the other should be down. I point this out to you to make you aware that when we don’t have a correlated market, it means something is wrong. As traders you need to be aware of this and proceed with your eyes wide open. Asia traded Higher with the exception of the Singapore exchange. Europe is trading Lower except the London exchange.
Possible challenges to traders
Core PPI m/m is out at 8:30 AM EST. This is Major.
PPI m/m is out at 8:30 AM EST. This is Major.
Unemployment Claims are out at 8:30 AM EST. This is Major.
CB Leading Index m/m is out at 9:30 AM EST. This is Major.
Natural Gas Storage is out at 10:30 AM EST. This is Major.
30 Year Bond Auction Starts at 1 PM EST. This is Major.
Traders, please note that we’ve changed the Bond instrument from the 10 Year (ZN) to the 2 Year (ZT). They work exactly the same.
We’ve elected to switch gears a bit and show correlation between the 2-year Treasury notes (ZT) and the S&P futures contract. The YM contract is the Dow Jones Industrial Average, and the purpose is to show reverse correlation between the two instruments. Remember it’s likened to a seesaw, when up goes up the other should go down and vice versa.
Yesterday the ZT slide Lower at around 7:30 AM EST with the CPI data pending. The Dow climbed Higher at the same time. Look at the charts below and you’ll see a pattern for both assets. The Dow moved Higher at 7:30 AM EST and the ZT slide Lower at around the same time. These charts represent the newest version of Bar Charts, and I’ve changed the timeframe to a 15-minute chart to display better. This represented a Short opportunity on the 2-year note, as a trader you could have netted about a dozen plus ticks per contract on this trade. Each tick is worth $6.25. Please note: the front month for ZT is now Sep ’25 and the Dow is still Jun ’25. I’ve changed the format to filled Candlesticks (not hollow) such that it may be more apparent and visible.
Charts courtesy of BarCharts
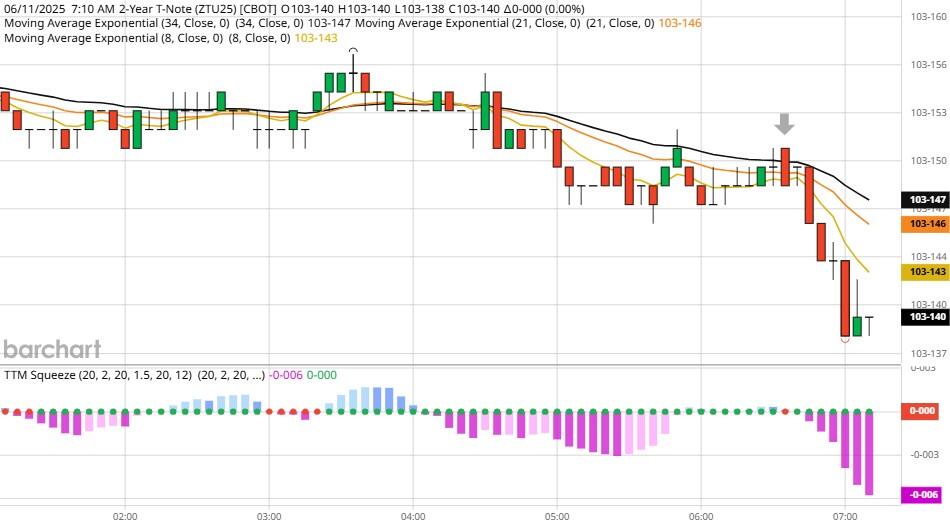
ZT -Sep 25 – 6/11/25
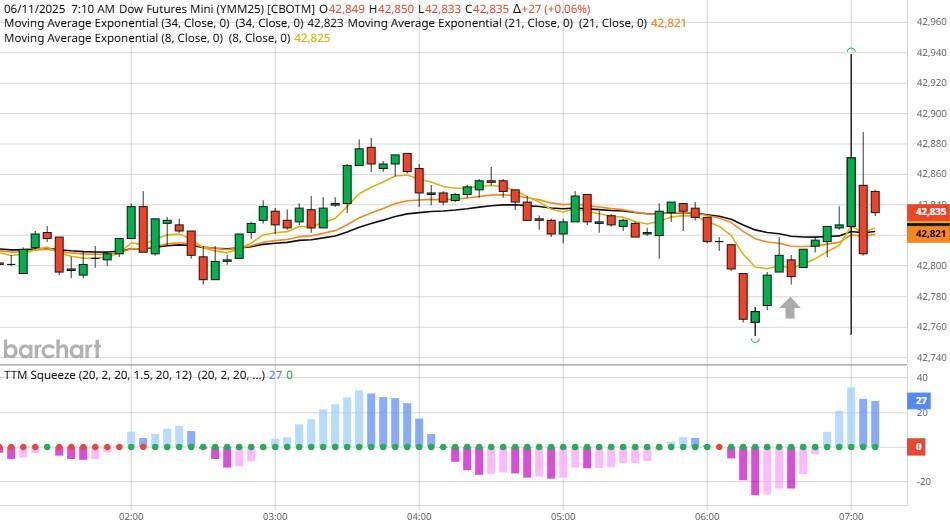
Dow – Jun 2025- 6/11/25
Bias
Yesterday we gave the markets a Downside bias as crude and Gold were Higher. The markets did close Lower as the Dow dropped 1 point, and the other indices lost ground as well. Today we aren’t dealing with a correlated market, and our bias is to the Downside.
Could this change? Of Course. Remember anything can happen in a volatile market.
Commentary
The markets were poised to go Lower yesterday but the markets waited for the all-important CPI data. The CPI lost less than expected which is a positive in one respect as inflation is not as bad but a negative in that the Fed will be more reluctant to Lower interest rates. Want to learn Market Correlation and determine market direction hours before the Opening Bell?