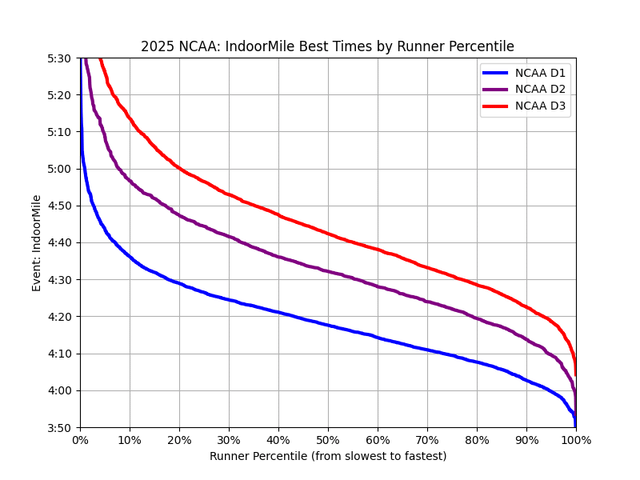
Example1: if you want to run at the college level and can run the mile in 4:30, you will be better then 20% of D1 runners already based on seasonal bests , and you will also be already better then 80% of D3 runners. So might be best to run D1.
Example2: if you run for a D1 team and your best mile of the season was 4.40 you are in the bottom 10% of D1 runners.
Note: some injured/slower runners may not run in bigger track meets so may not be included.
Data pulled in python and plots made in python.
Posted by Large_Cantaloupe8905
8 comments
This is terrible data. I knew the answer was “no” before I looked at a single graph!
Wow times are wild. The kids can run!
This is super cool! Great work!
Love how clear the stratification is but also how top D3 runners could clearly be in D1.
Do you have any info about the left tails? Are they often like athletes doing secondary events or coming back from injury?
my personal best was 4:30 in high school for soccer tryouts. There was a kid a grade above me that ran a sub 4 minute mile.
Are these the numbers for men, women, or both?
Nice! My son is a rising senior and distance runner; these align with what we’ve seen re: recruiting standards.
Can you share data sources? Code?
I’m used to seeing CDF’s with the 0-100% on the y-axis, but this format works ok.
May be of more interest in r/trackandfield or r/AdvancedRunning
my brother ran D3 and had a 4:20 mile.
I’m curious the accuracy here or if there are aspects to D1 I am missing.
Always thought anything 4:10 or below was the breaking point for D1.
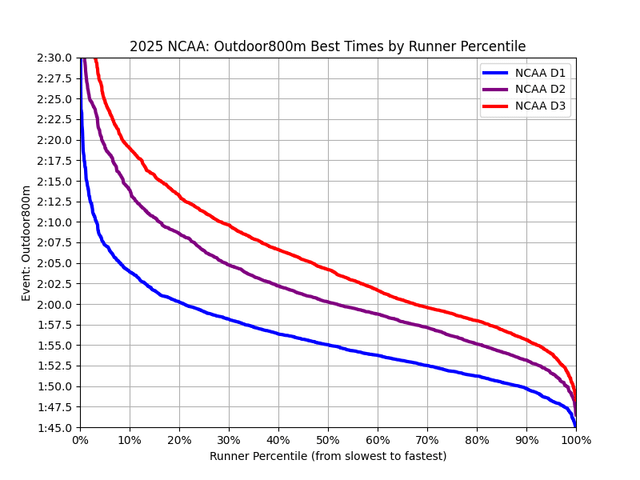
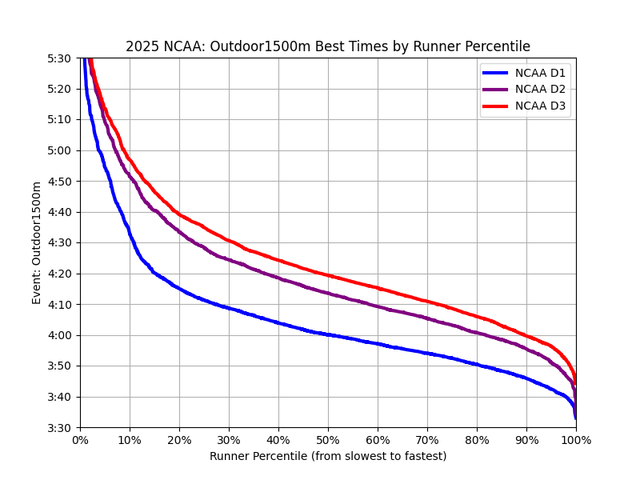
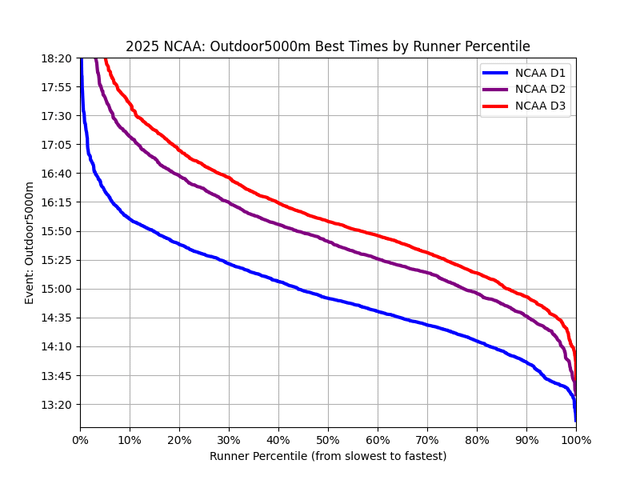
Cool data. Gonna guess the kink in the curve for D1 outdoor 5k is around the regional qualifier. 1:55/4:00/8:32/14:50 being around the median jives with my experience, it seemed to me while I was running that breaking 4:00 for 1500 was a good standard to be an average D1 guy, while 3:45ish was a good standard to be fairly elite (top 10%).
Comments are closed.