![[OC] How Did Covid Impact the Financials of Major U.S. Passenger Airlines](https://www.europesays.com/wp-content/uploads/2025/06/apdg9zzby97f1-1080x1024.png)
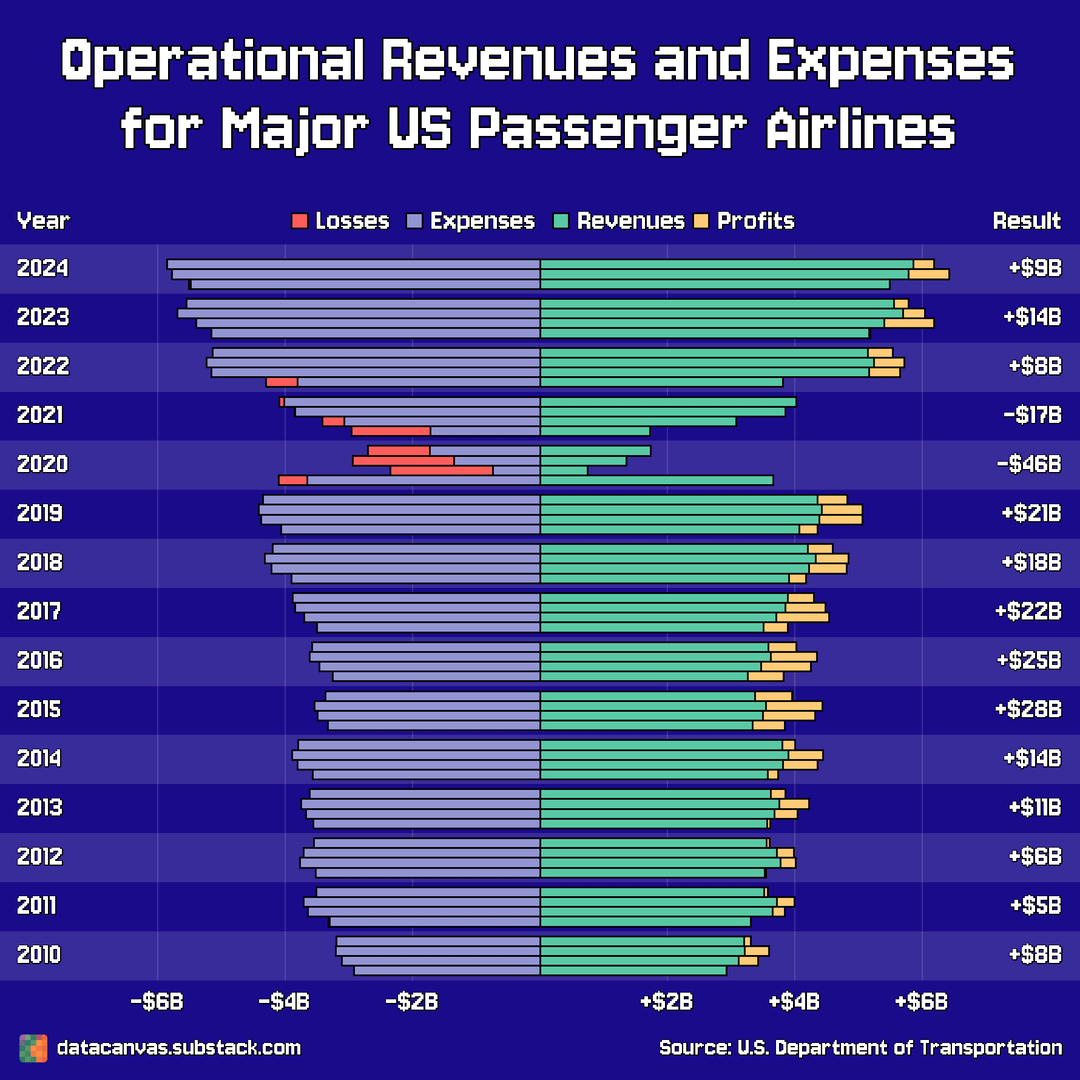
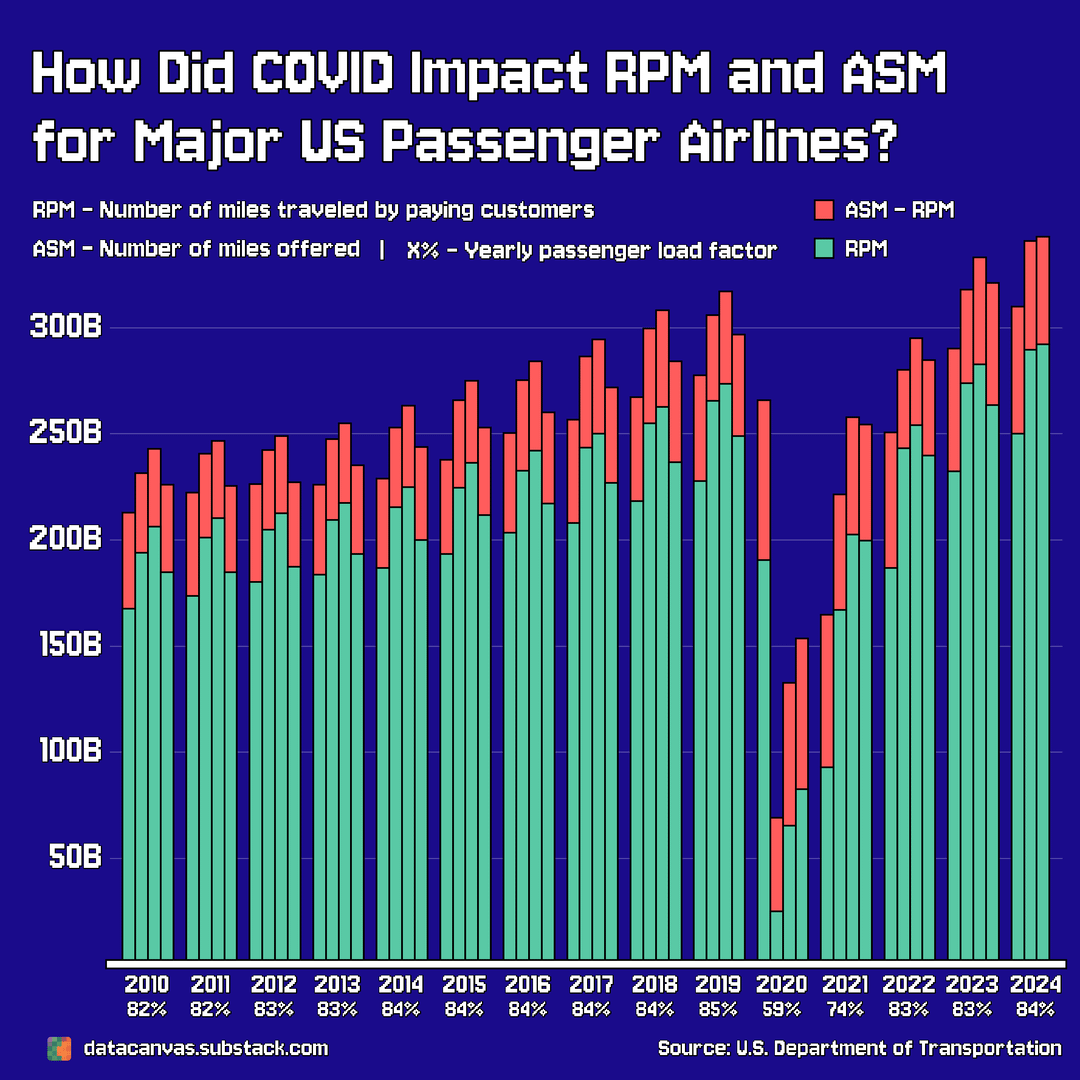
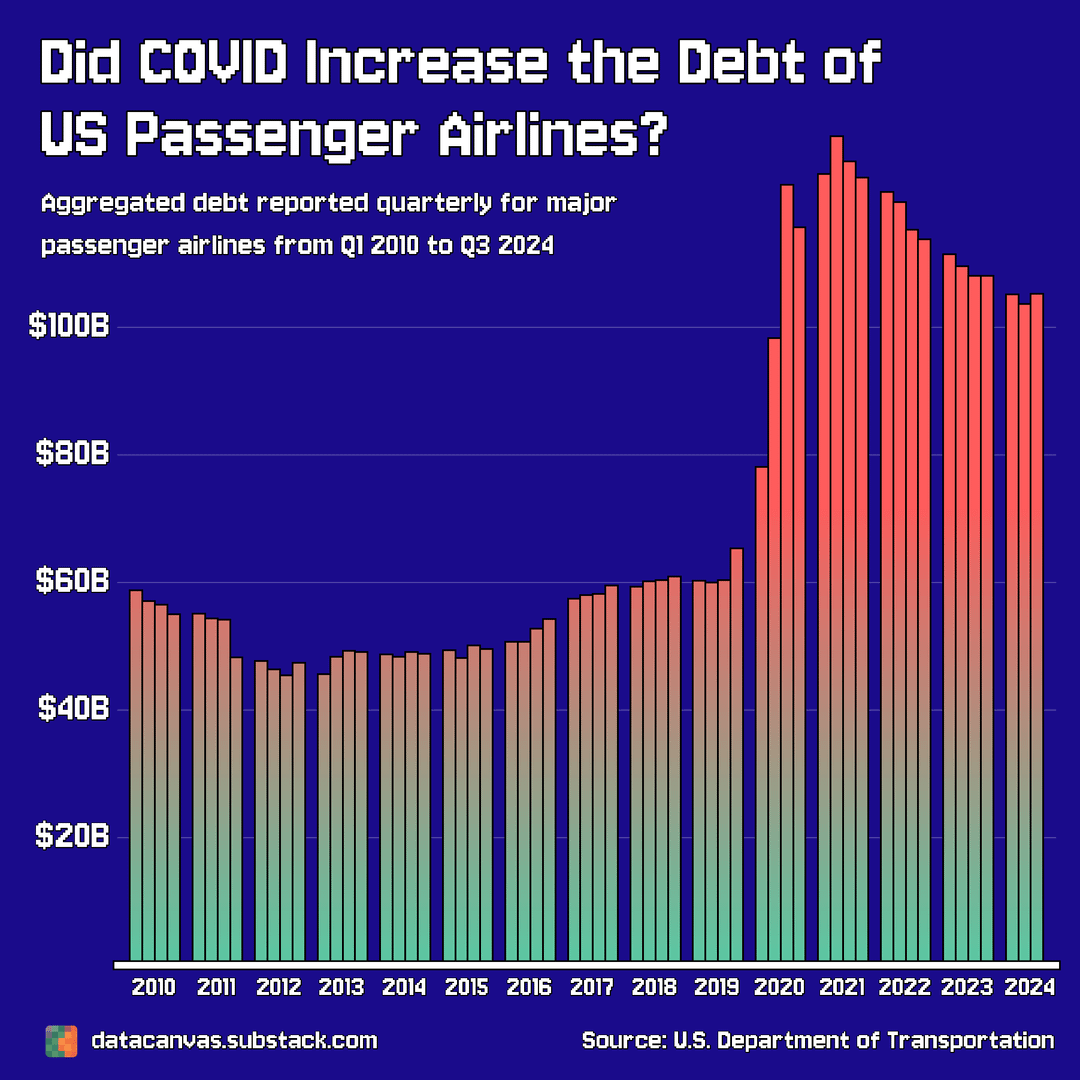
Data source: Airline Quarterly Financial Review – Majors
Tools used: Matplotlib
Colors:
- Background #1a0b8b
- Green #59C9A5
- Red #FF5C5C
- Gold #FFCB77
- Light purple #9395D3
Fonts:
- Jersey 10 (google font)
I wanted to create charts with a pixelated style because I haven't done that before. I realize that the text isn't optimal in terms of readability, but I tried finding a pixelated font that's easy enough to read.
I want to improve so I appreciate all feedback I can get on both the design and the use of data.
If you have datasets or topics that you want me to create unique charts for, let me know! Either here on Reddit or at datacanvas.substack.com
Posted by oscarleo0
2 comments
I was glad the revenue recovered, but the debt graph really puts it into perspective. Nice addition!
The only conclusion I can draw is that relative ticket prices are too low now. All right folks, expect price hikes.
Comments are closed.